
4.3: Raman Spectroscopy
- Page ID
- 55879

Raman and Surface-Enhanced Raman Spectroscopy
What is Raman Spectroscopy
Raman spectroscopy is a powerful tool for determining chemical species. As with other spectroscopic techniques, Raman spectroscopy detects certain interactions of light with matter. In particular, this technique exploits the existence of Stokes and Anti-Stokes scattering to examine molecular structure. When radiation in the near infrared (NIR) or visible range interacts with a molecule, several types of scattering can occur. Three of these can be seen in the energy diagram in Figure \(\PageIndex{1}\).
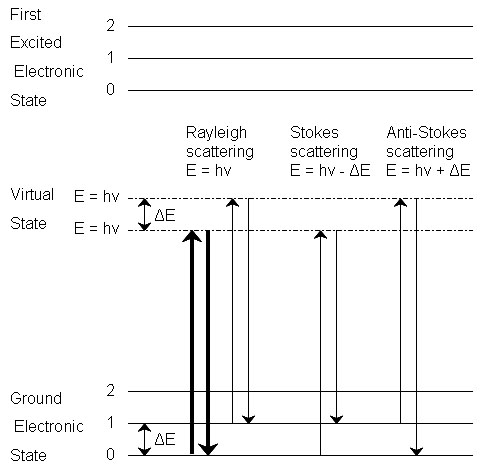
In all three types of scattering, an incident photon of energy hν raises the molecule from a vibrational state to one of the infinite number of virtual states located between the ground and first electronic states. The type of scattering observed is dependent on how the molecule relaxes after excitation.
Rayleigh Scattering
- The molecule is excited to any virtual state.
- The molecule relaxes back to its original state.
- The photon is scattered elastically, leaving with its original energy.
Stokes Scattering
- The molecule is excited to any virtual state.
- The molecule relaxes back to a higher vibrational state than it had originally.
- The photon leaves with energy hν-ΔE and has been scattered inelastically.
Anti-Stokes Scattering
- The molecule begins in a vibrationally excited state.
- The molecule is excited to any virtual state.
- The molecule relaxes back to a lower vibrational state than it had originally.
- The photon leaves with energy hν+ΔE, and has been scattered superelastically.
Rayleigh scattering is by far the most common transition, due to the fact that no change has to occur in the vibrational state of the molecule. The anti-Stokes transition is the least common, as it requires the molecule to be in a vibrationally excited state before the photon is incident upon it. Due to the lack of intensity of the anti-Stokes signal and filtering requirements that eliminate photons with incident energy and higher, generally only Stokes scattering is used in Raman measurements. The relative intensities of Rayleigh, Stokes and anti-Stokes scattering can be seen in Figure \(\PageIndex{2}\).
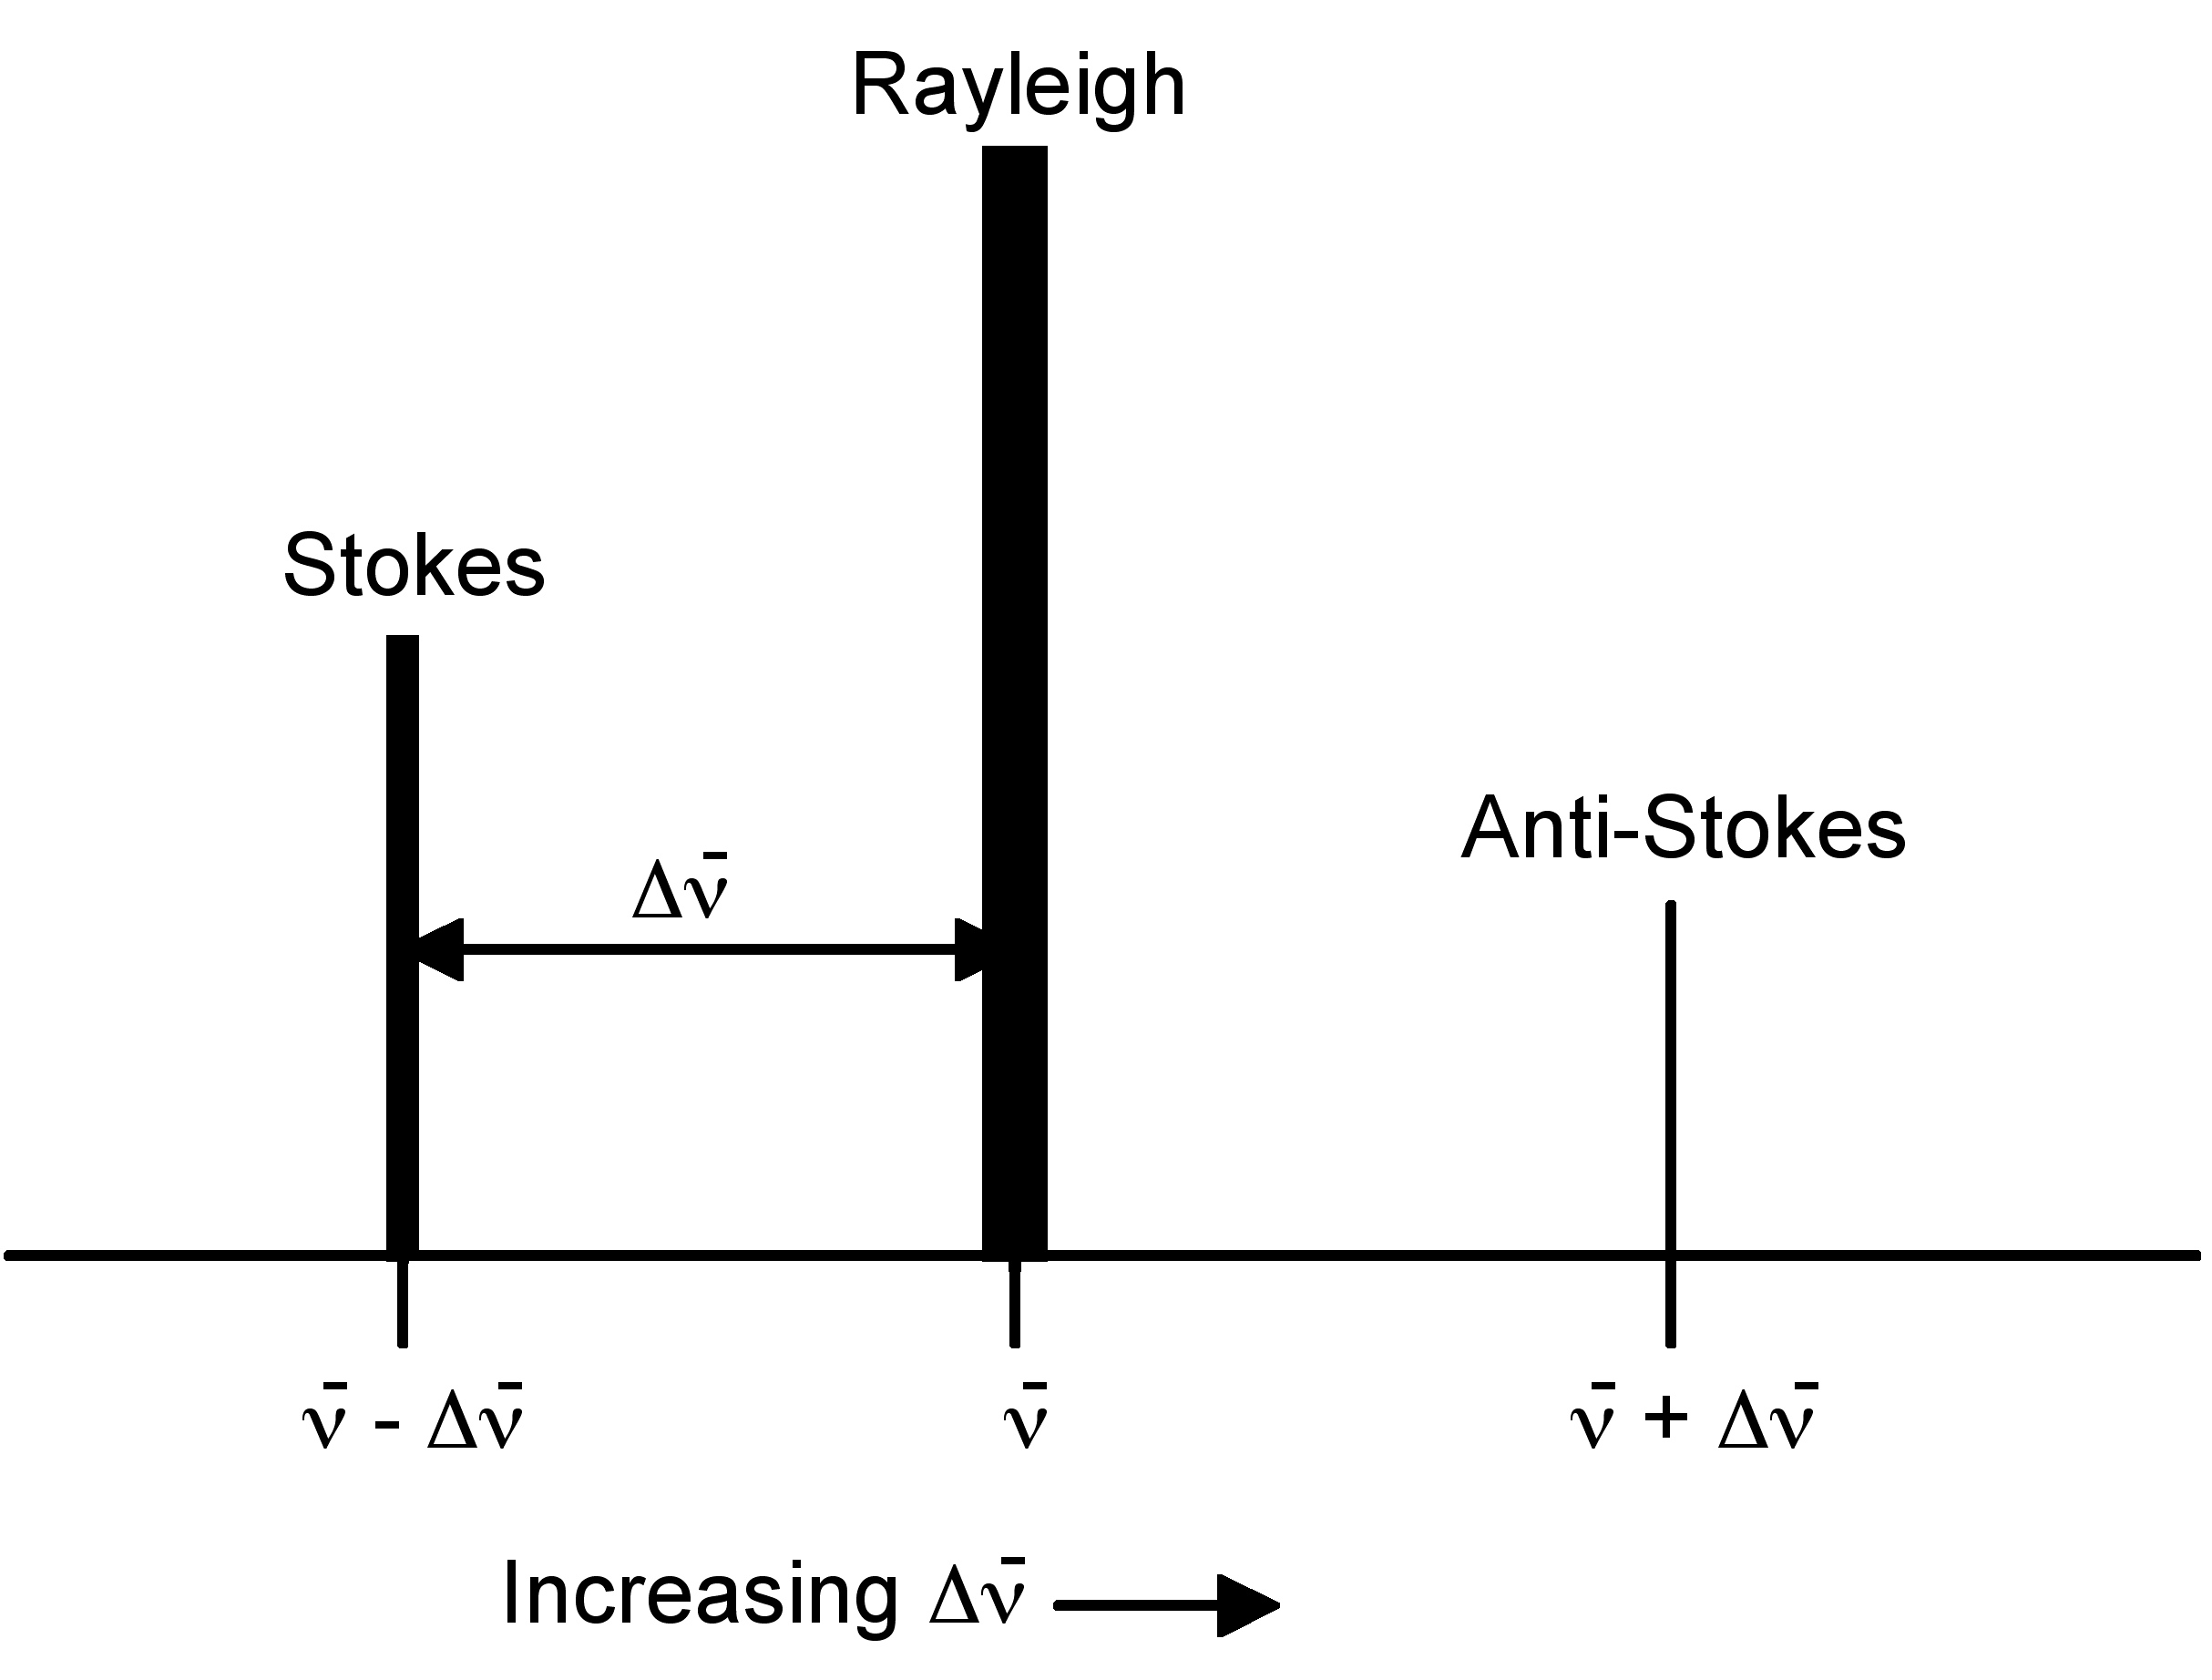
Raman spectroscopy observes the change in energy between the incident and scattered photons associated with the Stokes and anti-Stokes transitions. This is typically measured as the change in the wavenumber (cm-1), from the incident light source. Because Raman measures the change in wavenumber, measurements can be taken using a source at any wavelength; however, near infrared and visible radiation are commonly used. Photons with ultraviolet wavelengths could work as well, but tend to cause photodecomposition of the sample.
Comparison between Raman and Infrared Spectroscopy
Raman spectroscopy sounds very much like infrared (IR) spectroscopy; however, IR examines the wavenumber at which a functional group has a vibrational mode, while Raman observes the shift in vibration from an incident source. The Raman frequency shift is identical to the IR peak frequency for a given molecule or functional group. As mentioned above, this shift is independent of the excitation wavelength, giving versatility to the design and applicability of Raman instruments.
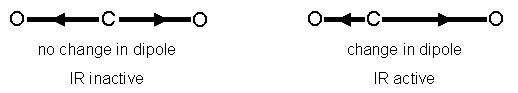
The cause of the vibration is also mechanistically different between IR and Raman. This is because the two operate on different sets of selection rules. IR absorption requires a dipole moment or change in charge distribution to be associated with the vibrational mode. Only then can photons of the same energy as the vibrational state of molecule interact. A schematic of this can be seen in Figure \(\PageIndex{3}\).
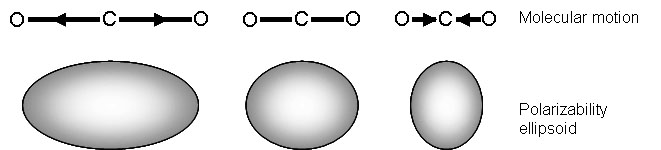
Raman signals, on the other hand, due to scattering, occur because of a molecule’s polarizability, illustrated in Figure \(\PageIndex{4}\). Many molecules that are inactive or weak in the IR will have intense Raman signals. This results in often complementary techniques.
What does Raman Spectroscopy Measure?
Raman activity depends on the polarizability of a bond. This is a measure of the deformability of a bond in an electric field. This factor essentially depends on how easy it is for the electrons in the bond to be displaced, inducing a temporary dipole. When there is a large concentration of loosely held electrons in a bond, the polarizability is also large, and the group or molecule will have an intense Raman signal. Because of this, Raman is typically more sensitive to the molecular framework of a molecule rather than a specific functional group as in IR. This should not be confused with the polarity of a molecule, which is a measure of the separation of electric charge within a molecule. Polar molecules often have very weak Raman signals due to the fact that electronegative atoms hold electrons so closely.
Raman spectroscopy can provide information about both inorganic and organic chemical species. Many electron atoms, such as metals in coordination compounds, tend to have many loosely bound electrons, and therefore tend to be Raman active. Raman can provide information on the metal ligand bond, leading to knowledge of the composition, structure, and stability of these complexes. This can be particularly useful in metal compounds that have low vibrational absorption frequencies in the IR. Raman is also very useful for determining functional groups and fingerprints of organic molecules. Often, Raman vibrations are highly characteristic to a specific molecule, due to vibrations of a molecule as a whole, not in localized groups. The groups that do appear in Raman spectra have vibrations that are largely localized within the group, and often have multiple bonds involved.
What is Surface-Enhanced Raman Spectroscopy
Raman measurements provide useful characterization of many materials. However, the Raman signal is inherently weak (less than 0.001% of the source intensity), restricting the usefulness of this analytical tool. Placing the molecule of interest near a metal surface can dramatically increase the Raman signal. This is the basis of surface-enhanced Raman spectroscopy (SERS). There are several factors leading to the increase in Raman signal intensity near a metal surface
- The distance to the metal surface.
- Signal enhancement drops off with distance from the surface.
- The molecule of interest must be close to the surface for signal enhancement to occur.
- Details about the metal surface: morphology and roughness.
- This determines how close and how many molecules can be near a particular surface area.
- The properties of the metal.
- Greatest enhancement occurs when the excitation wavelength is near the plasma frequency of the metal.
- The relative orientation of the molecule to the normal of the surface.
- The polarizability of the bonds within the molecule can be affected by the electrons in the surface of the metal.
Surface-Enhanced Raman Spectroscopy for the Study of Surface Chemistry
The ever-rising interest in nanotechnology involves the synthesis and application of materials with a very high surface area to volume ratio. This places increasing importance on understanding the chemistry occurring at a surface, particularly the surface of a nanoparticle. Slight modifications of the nanoparticle or its surrounding environment can greatly affect many properties including the solubility, biological toxicity, and reactivity of the nanomaterial. Noble metal nanomaterials are of particular interest due to their unique optical properties and biological inertness.
One tool employed to understand the surface chemistry of noble metal nanomaterial, particularly those composed of gold or silver is surface-enhanced Raman spectroscopy (SERS). Replacing a metal surface with a metal nanoparticle increases the available surface area for the adsorption of molecules. Compared to a flat metal surface, a similar sample size using nanoparticles will have a dramatically stronger signal, since signal intensity is directly related to the concentration of the molecule of interest. Due to the shape and size of the structure, the electrons in the nanoparticle oscillate collectively when exposed to incident electromagnetic radiation. This is called the localized surface plasmon resonance (LSPR) of the nanoparticle. The LSPR of the nanoparticles boosts the Raman signal intensity dramatically for molecules of interest near the surface of the nanoparticle. In order to maximize this effect, a nanoparticle should be selected with its resonant wavelength falling in the middle of the incident and scattered wavelengths.
The overall intensity enhancement of SERS can be as large as a factor of 106, with the surface plasmon resonance responsible for roughly four orders of magnitude of this signal increase. The other two orders of magnitude have been attributed to chemical enhancement mechanisms arising charge interactions between the metal particle and the adsorbate or from resonances in the adsorbate alone, as discussed above.
Why is SERS Useful for Studying Surface Chemistry?
Traditionally, SERS uses nanoparticles made of conductive materials, such as gold, to learn more about a particular molecule. However, of interest in many growing fields that incorporate nanotechnology is the structure and functionalization of a nanoparticle stabilized by some surfactant or capping agent. In this case, SERS can provide valuable information regarding the stability and surface structure of the nanoparticle. Another use of nanoparticles in SERS is to provide information about a ligand’s structure and the nature of ligand binding. In many applications it is important to know whether a molecule is bound to the surface of the nanoparticle or simply electrostatically interacting with it.
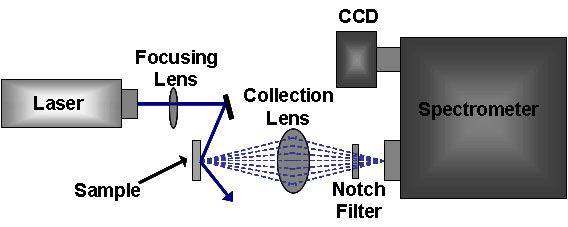
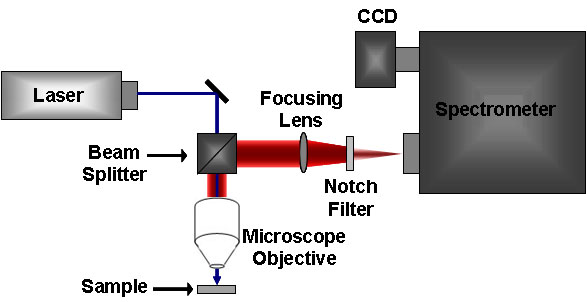
Sample Preparation and Instrumental Details
The standard Raman instrument is composed of three major components. First, the instrument must have an illumination system. This is usually composed of one or more lasers. The major restriction for the illumination system is that the incident frequency of light must not be absorbed by the sample or solvent. The next major component is the sample illumination system. This can vary widely based on the specifics of the instrument, including whether the system is a standard macro-Raman or has micro-Raman capabilities. The sample illumination system will determine the phase of material under investigation. The final necessary piece of a Raman system is the spectrometer. This is usually placed 90° away from the incident illumination and may include a series of filters or a monochromator. An example of a macro-Raman and micro-Raman setup can be Figure \(\PageIndex{5}\) and Figure \(\PageIndex{6}\). A macro-Raman spectrometer has a spatial resolution anywhere from 100 μm to one millimeter while a micro-Raman spectrometer uses a microscope to magnify its spatial resolution.
Characterization of Single-Walled Carbon Nanotubes by Raman Spectroscopy
Carbon nanotubes (CNTs) have proven to be a unique system for the application of Raman spectroscopy, and at the same time Raman spectroscopy has provided an exceedingly powerful tool useful in the study of the vibrational properties and electronic structures of CNTs. Raman spectroscopy has been successfully applied for studying CNTs at single nanotube level.
The large van der Waals interactions between the CNTs lead to an agglomeration of the tubes in the form of bundles or ropes. This problem can be solved by wrapping the tubes in a surfactant or functionalizing the SWNTs by attaching appropriate chemical moieties to the sidewalls of the tube. Functionalization causes a local change in the hybridization from sp2 to sp3 of the side-wall carbon atoms, and Raman spectroscopy can be used to determine this change. In addition information on length, diameter, electronic type (metallic or semiconducting), and whether nanotubes are separated or in bundle can be obtained by the use of Raman spectroscopy. Recent progress in understanding the Raman spectra of single walled carbon nanotubes (SWNT) have stimulated Raman studies of more complicated multi-wall carbon nanotubes (MWNT), but unfortunately quantitative determination of the latter is not possible at the present state of art.
Characterizing SWNT's
Raman spectroscopy is a single resonance process, i.e., the signals are greatly enhanced if either the incoming laser energy (Elaser) or the scattered radiation matches an allowed electronic transition in the sample. For this process to occur, the phonon modes are assumed to occur at the center of the Brillouin zone (q = 0). Owing to their one dimensional nature, the Π-electronic density of states of a perfect, infinite, SWNTs form sharp singularities which are known as van Hove singularities (vHs), which are energetically symmetrical with respect to Fermi level (Ef) of the individual SWNTs. The allowed optical transitions occur between matching vHs of the valence and conduction band of the SWNTs, i.e., from first valence band vHs to the first conduction band vHs (E11) or from the second vHs of the valence band to the second vHs of the conduction band (E22). Since the quantum state of an electron (k) remains the same during the transition, it is referred to as k-selection rule.
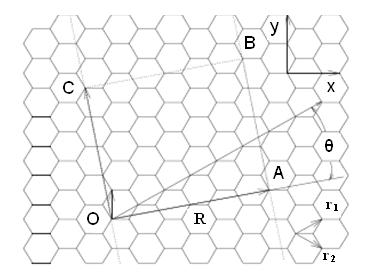
The electronic properties, and therefore the individual transition energies in SWNTs are given by their structure, i.e., by their chiral vector that determines the way SWNT is rolled up to form a cylinder. Figure \(\PageIndex{7}\) shows a SWNT having vector R making an angle θ, known as the chiral angle, with the so-called zigzag or r1 direction.
Raman spectroscopy of an ensemble of many SWNTs having different chiral vectors is sensitive to the subset of tubes where the condition of allowed transition is fulfilled. A ‘Kataura-Plot’ gives the allowed electronic transition energies of individual SWNTs as a function of diameter d, hence information on which tubes are resonant for a given excitation wavelength can be inferred. Since electronic transition energies vary roughly as 1/d, the question whether a given laser energy probes predominantly semiconducting or metallic tubes depends on the mean diameter and diameter distribution in the SWNT ensemble. However, the transition energies that apply to an isolated SWNT do not necessarily hold for an ensemble of interacting SWNTs owing to the mutual van der Waals interactions.
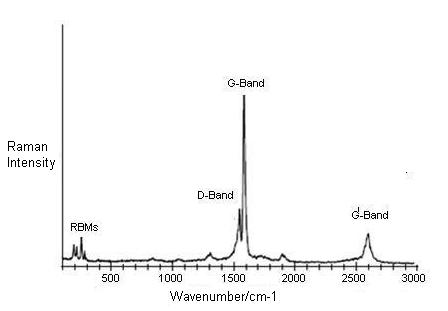
Figure \(\PageIndex{8}\) shows a typical Raman spectrum from 100 to 3000 cm-1 taken of SWNTs produced by catalytic decomposition of carbon monoxide (HiPco-process). The two dominant Raman features are the radial breathing mode (RBM) at low frequencies and tangential (G-band) multifeature at higher frequencies. Other weak features, such as the disorder induced D-band and the G’ band (an overtone mode) are also shown.
Modes in the Raman Spectra of SWNTs
Radial Breamthing Modes (RBMs)
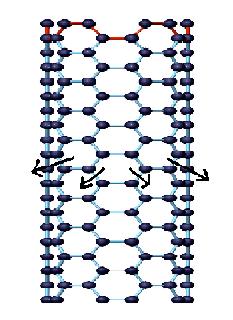
Out of all Raman modes observed in the spectra of SWNTs, the radial breathing modes are unique to SWNTs. They appear between 150 cm-1 < ωRBM < 300 cm-1 from the elastically scattered laser line. It corresponds to the vibration of the C atoms in the radial direction, as if the tube is breathing (Figure \(\PageIndex{9}\)). An important point about these modes is the fact that the energy (or wavenumber) of these vibrational modes depends on the diameter (d) of the SWNTs, and not on the way the SWNT is rolled up to form a cylinder, i.e., they do not depend on the θ of the tube.
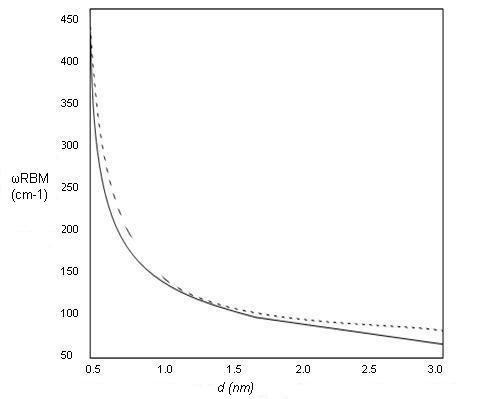
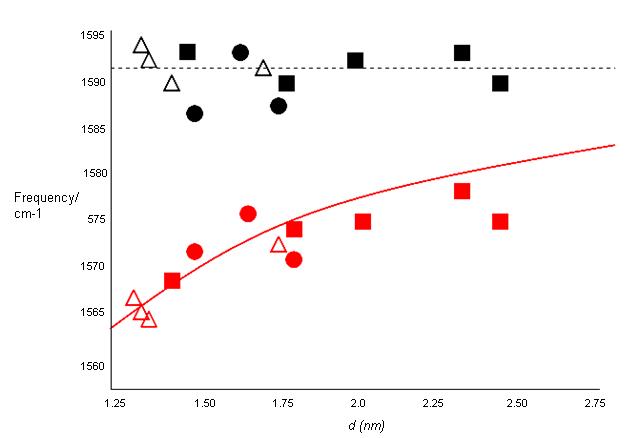
These features are very useful for characterizing nanotube diameters through the relation ωRBM = A/d + B, where A and B are constants and their variations are often attributed to environmental effects, i.e., whether the SWNTs are present as individual tubes wrapped in a surfactant, isolated on a substrate surface, or in the form of bundles. However, for typical SWNT bundles in the diameter range, d = 1.5 ± 0.2 nm, A = 234 cm-1 nm and B = 10 cm-1(where B is an upshift coming from tube-tube interactions). For isolated SWNTs on an oxidized Si substrate, A= 248 cm-1 nm and B = 0. As can be seen from Figure \(\PageIndex{10}\), the relation ωRBM = A/d + B holds true for the usual diameter range i.e., when d lies between 1 and 2 nm. However, for d less than 1 nm, nanotube lattice distortions lead to chirality dependence of ωRBM and for large diameters tubes when, d is more than 2 nm the intensity of RBM feature is weak and is hardly observable.
Hence, a single Raman measurement gives an idea of the tubes that are in resonance with the laser line, but does not give a complete characterization of the diameter distribution of the sample. However, by taking Raman spectra using many laser lines, a good characterization of the diameter distributions in the sample can be obtained. Also, natural line widths observed for isolated SWNTs are ωRBM = 3 cm-1, but as the tube diameter is increased, broadening is observed which is denoted by ΓRBM. It has been observed that for d > 2 nm, ΓRBM > 20 cm-1. For SWNT bundles, the line width does not reflect ΓRMB, it rather reflects an ensemble of tubes in resonance with the energy of laser.
Variation of RBM Intensities Upon Functionalization
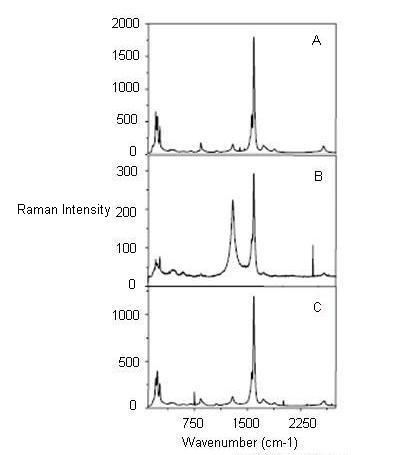
Functionalization of SWNTs leads to variations of relative intensities of RBM compared to the starting material (unfunctionalized SWNTs). Owing to the diameter dependence of the RBM frequency and the resonant nature of the Raman scattering process, chemical reactions that are sensitive to the diameter as well as the electronic structure, i.e., metallic or semiconducting of the SWNTs can be sorted out. The difference in Raman spectra is usually inferred by thermal defunctionalization, where the functional groups are removed by annealing. The basis of using annealing for defunctionalizing SWNTs is based on the fact that annealing restores the Raman intensities, in contrast to other treatments where a complete disintegration of the SWNTs occurs. Figure \(\PageIndex{11}\) shows the Raman spectra of the pristine, functionalized and annealed SWNTs. It can be observed that the absolute intensities of the radial breathing modes is drastically reduced after functionalization. This decrease can be attributed to vHs, which themselves are a consequence of translational symmetry of the SWNTs. Since the translational symmetry of the SWNTs is broken as a result of irregular distribution of the sp3-sites due to the functionalization, these vHs are broadened and strongly reduced in intensity. As a result, the resonant Raman cross section of all modes is strongly reduced as well.
For an ensemble of functionalized SWNTs, a decrease in high wavenumber RBM intensities has been observed which leads to an inference that destruction of small diameter SWNT takes place. Also, after prolonged treatment with nitric acid and subsequent annealing in oxygen or vacuum, diameter enlargement of SWNTs is observed from the disappearance of RBMs from small diameter SWNTs and the appearance of new RBMs characteristic of SWNTs with larger diameters. In addition, laser irradiation seems to damage preferentially small diameter SWNTs. In all cases, the decrease of RBM intensities is either attributed to the complete disintegration of SWNTs or reduction in resonance enhancement of selectively functionalized SWNTs. However, change in RBM intensities can also have other reasons. One reason is doping induced bleaching of electronic transitions in SWNTs. When a dopant is added, a previously occupied electronic state can be filled or emptied, as a result of which Ef in the SWNTs is shifted. If this shift is large enough and the conduction band vHs corresponding to the respective Eiitransition that is excited by the laser light gets occupied (n-type doping) or the valence band vHs is emptied (p-type doping), the resonant enhancement is lost as the electronic transitions are quenched.
Sample morphology has also seen to affect the RBMs. The same unfunctionalized sample in different aggregation states gives rise to different spectra. This is because the transition energy, Eii depends on the aggregation state of the SWNTs.
Tangential Modes (G-Band)
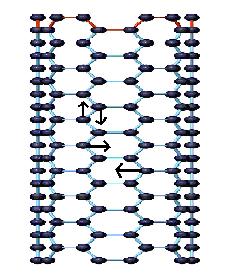
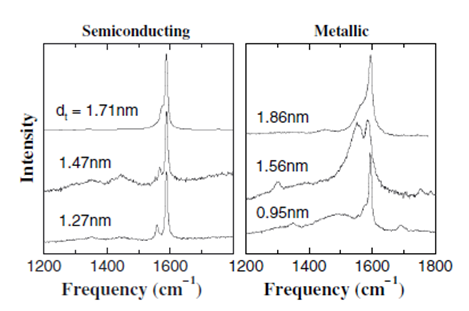
The tangential modes are the most intensive high-energy modes of SWNTs and form the so-called G-band, which is typically observed at around 1600 cm-1. For this mode, the atomic displacements occur along the cicumferential direction (Figure \(\PageIndex{12}\)). Spectra in this frequency can be used for SWNT characterization, independent of the RBM observation. This multi-peak feature can, for example, also be used for diameter characterization, although the information provided is less accurate than the RBM feature, and it gives information about the metallic character of the SWNTs in resonance with laser line.
The tangential modes are useful in distinguishing semiconducting from metallic SWNTs. The difference is evident in the G- feature (Figure \(\PageIndex{13}\) and \(\PageIndex{14}\)) which broadens and becomes asymmetric for metallic SWNTs in comparison with the Lorentzian lineshape for semiconducting tubes, and this broadening is related to the presence of free electrons in nanotubes with metallic character. This broadened G-feature is usually fit using a Breit-Wigner-Fano (BWF) line that accounts for the coupling of a discrete phonon with a continuum related to conduction electrons. This BWF line is observed in many graphite-like materials with metallic character, such as n-doped graphite intercalation compounds (GIC), n-doped fullerenes, as well as metallic SWNTs. The intensity of this G- mode depends on the size and number of metallic SWNTs in a bundle (Figure \(\PageIndex{15}\)).

Charge of G-band Line Shape on Functionalization
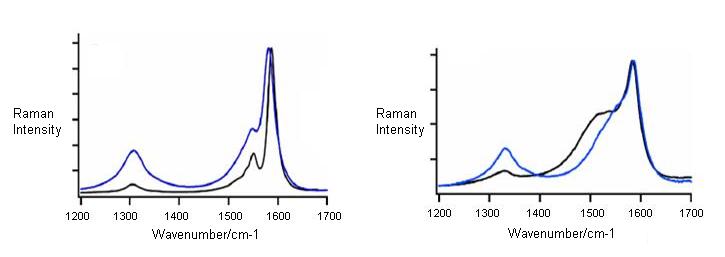
Chemical treatments are found to affect the line shape of the tangential line modes. Selective functionalization of SWNTs or a change in the ratio of metallic to semiconducting SWNTs due to selective etching is responsible for such a change. According to Figure \(\PageIndex{16}\), it can be seen that an increase or decrease of the BWF line shape is observed depending on the laser wavelength. At λexc = 633 nm, the preferentially functionalized small diameter SWNTs are semiconducting, therefore the G-band shows a decrease in the BWG asymmetry. However, the situation is reversed at 514 nm, where small metallic tubes are probed. BWF resonance intensity of small bundles increases with bundle thickness, so care should be taken that the effect ascribed directly to functionalization of the SWNTs is not caused by the exfoliation of the previously bundles SWNT.
Disorder-Induced D-band
This is one of the most discussed modes for the characterization of functionalized SWNTs and is observed at 1300-1400 cm-1. Not only for functionalized SWNTs, D-band is also observed for unfunctionalized SWNTs. From a large number of Raman spectra from isolated SWNTs, about 50% exhibit observable D-band signals with weak intensity (Figure \(\PageIndex{14}\)).
A large D-peak compared with the G-peak usually means a bad resonance condition, which indicates the presence of amorphous carbon.
The appearance of D-peak can be interpreted due to the breakdown of the k-selection rule. It also depends on the laser energy and diameter of the SWNTs. This behavior is interpreted as a double resonance effect, where not only one of the direct, k-conserving electronic transitions, but also the emission of phonon is a resonant process. In contrast to single resonant Raman scattering, where only phonons around the center of the Brillouin zone (q = 0) are excited, the phonons that provoke the D-band exhibit a non-negligible q vector. This explains the double resonance theory for D-band in Raman spectroscopy. In few cases, the overtone of the D-band known as the G’-band (or D*-band) is observed at 2600-2800 cm-1, and it does not require defect scattering as the two phonons with q and –q are excited. This mode is therefore observed independent of the defect concentration.
The presence of D-band cannot be correlated to the presence of various defects (such as hetero-atoms, vacancies, heptagon-pentagon pairs, kinks, or even the presence of impurities, etc). Following are the two main characteristics of the D-band found in carbon nanotubes:
- Small linewidths: ΓD values for SWNTs range from 40 cm-1 down to 7 cm-1.
- Lower frequencies: D-band frequency is usually lower than the frequency of sp2-based carbons, and this downshift of frequency shows 1/d dependence.
D-band Intensity as a Measure of Functionalization vs. Defect Density
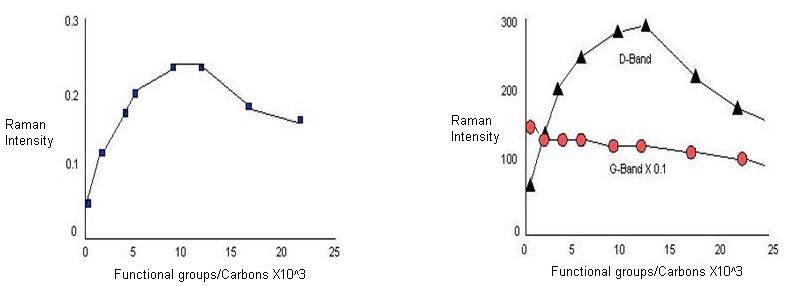
Since D-peak appears due to the presence defects, an increase in the intensity of the band is taken as a fingerprint for successful functionalization. But, whether D-band intensity is a measure of degree of functionalization or not is still sure. So, it is not correct to correlate D-peak intensity or D-peak area to the degree of functionalization. From Figure \(\PageIndex{17}\), it can be observed that for lower degree of functionalization, intensity of the D-band scales linearly with defect density. As the degree of functionalization is further increased, both D and G-band area decrease, which is explained by the loss of resonance enhancement due to functionalization. Also, normalization of the D-peak intensity to the G-band in order to correct for changes in resonance intensities also leads to a decrease for higher densities of functional groups.
Limitations of Raman Spectroscopy
Though Raman spectroscopy has provides an exceedingly important tool for characterization of SWNTs, however, it suffers from few serious limitations. One of the main limitations of Raman spectroscopy is that it does not provide any information about the extent of functionalization in the SWNTs. The presence of D-band indicates disorder, i.e. side wall distribution, however it cannot differentiate between the number of substituents and their distribution. Following are the two main limitations of Raman Spectroscopy:
Quantification of Substituents
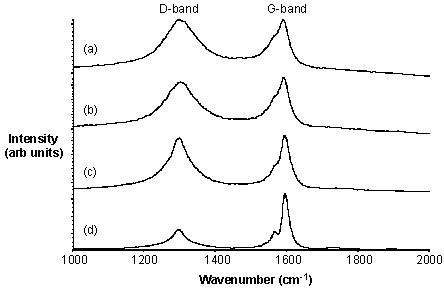
This can be illustrated by the following examples. Purified HiPco tubes may be fluorinated at 150 °C to give F-SWNTs with a C:F ratio of approximately 2.4:1. The Raman spectra (using 780 nm excitation) for F-SWNTs shows in addition to the tangential mode at ~1587 cm-1 an intense broad D (disorder) mode at ~ 1295 cm-1consistent with the side wall functionalization. Irrespective of the arrangements of the fluorine substituents, thermolysis of F-SWNTs results in the loss of fluorine and the re-formation of unfunctionalized SWNTs alnog with their cleavage into shorter length tubes. As can be seen from Figure \(\PageIndex{18}\), the intensity of the D-band decreases as the thermolysis temperature increases. This is consistent with the loss of F-substituents. The G-band shows a concomitant sharpening and increase in intensity.
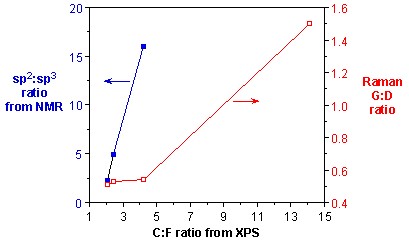
As discussed above, the presence of a significant D mode has been the primary method for determining the presence of sidewall functionalization. It has been commonly accepted that the relative intensity of the D mode versus the tangential G mode is a quantitative measure of level of substitution. However, as discussed below, the G:D ratio is also dependent on the distribution of substituents. Using Raman spectroscopy in combination with XPS analysis of F-SWNTs that have been subjected to thermolysis at different temperatures, a measure of the accuracy of Raman as a quantitative tool for determining substituent concentration can be obtained. As can be seen from Figure \(\PageIndex{19}\), there is essentially no change in the G:D band ratio despite a doubling amount of functional groups.Thus, at low levels of functionalization the use of Raman spectroscopy to quantify the presence of fluorine substituents is a clearly suspect.
On the basis of above data it can be concluded that Raman spectroscopy does not provide an accurate quantification of small differences at low levels of functionalization, whereas when a comparison between samples with high levels of functionalization or large differences in degree of functionalization is requires Raman spectroscopy provides a good quantification.
Number vs Distribution
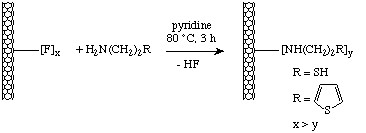
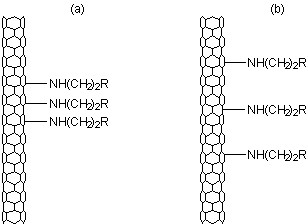
Fluorinated nanotubes may be readily functionalized by reaction with the appropriate amine in the presence of base according to the scheme shown in Figure \(\PageIndex{20}\).
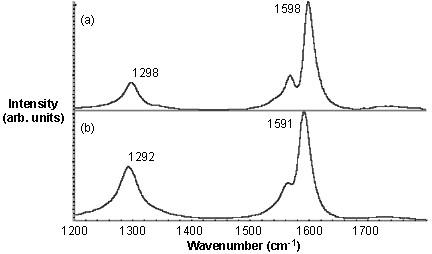
When the Raman spectra of the functionalized SWNTs is taken (Figure \(\PageIndex{21}\)), it is found out that the relative intensity of the disorder D-band at ~1290 cm-1versus the tangential G-band (1500 - 1600 cm-1) is much higher for thiophene-SWNT than thiol-SWNT. If the relative intensity of the D mode is the measure of the level of substitution, it can be concluded that there are more number of thiophene groups present per C than thiol groups. However, from the TGA weight loss data the SWNT-C:substituent ratios are calculated to be 19:1 and 17.5:1. Thus, contrary to the Raman data the TGA suggest that the number of substituents per C (in the SWNT) is actually similar for both substituents.
This result would suggest that Raman spectroscopy is potentially unsuccessful in correctly providing the information about the number of substituents on the SWNTs. Subsequent imaging of the functionalized SWNTs by STM showed that the distribution of the functional groups was the difference between the thiol and thiphene functionalized SWNTs (Figure \(\PageIndex{22}\)). Thus, relative ratio of the D- and G-bands is a measure of concentration and distribution of functional groups on SWNTs.
Multi-walled carbon nanotubes (MWNTs)
Most of the characteristic differences that distinguish the Raman spectra in SWNTs from the spectra of graphite are not so evident for MWNTs. It is because the outer diameter for MWNTs is very large and the ensemble of CNTs in them varies from small to very large. For example, the RBM Raman feature associated with a small diameter inner tube (less than 2 nm) can sometimes be observed when a good resonance condition is established, but since the RBM signal from large diameter tubes is usually too weak to be observable and the ensemble average of inner tube diameter broadens the signal, a good signal is not observed. However, when hydrogen gas in the arc discharge method is used, a thin innermost nanotube within a MWNT of diameter 1 nm can be obtained which gives strong RBM peaks in the Raman spectra.
Thereas the G+ - G- splitting is large for small diameter SWNT, the corresponding splitting of the G-band in MWNTs is both small in intensity and smeared out due to the effect of the diameter distribution. Therefore the G-band feature predominantly exists a weakly asymmetric characteristic lineshape, and a peak appearing close to the graphite frequency of 1582 cm-1.however for isolated MWNTs prepared in the presence of hydrogen gas using the arc discharge method, it is possible to observe multiple G-band splitting effects even more clearly than for the SWNTs, and this is because environmental effects become relatively small for the innermost nanotube in a MWNT relative to the interactions occurring between SWNTs and different environments. The Raman spectroscopy of MWNTs has not been well investigated up to now. The new directions in this field are yet to be explored.