
2.1: Melting Point Analysis
- Page ID
- 55838

Melting point (Mp) is a quick and easy analysis that may be used to qualitatively identify relatively pure samples (approximately <10% impurities). It is also possible to use this analysis to quantitatively determine purity. Melting point analysis, as the name suggests, characterizes the melting point, a stable physical property, of a sample in a straightforward manner, which can then be used to identify the sample.
Equipment
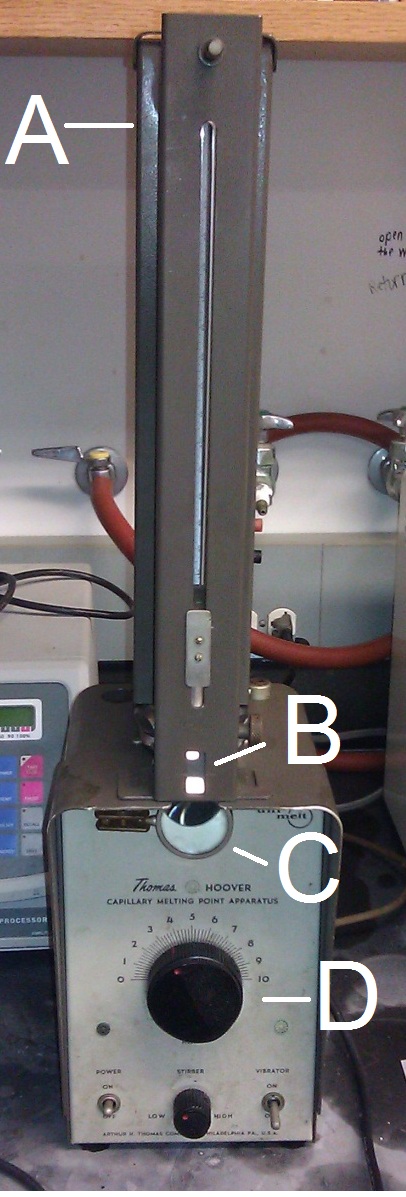
Although different designs of apparatus exist, they all have some sort of heating or heat transfer medium with a control, a thermometer, and often a backlight and magnifying lens to assist in observing melting (Figure \(\PageIndex{1}\)). Most models today utilize capillary tubes containing the sample submerged in a heated oil bath. The sample is viewed with a simple magnifying lens. Some new models have digital thermometers and controls and even allow for programming. Programming allows more precise control over the starting temperature, ending temperature and the rate of change of the temperature.
Sample Preparation
For melting point analysis, preparation is straight forward. The sample must be thoroughly dried and relatively pure ( <10% impurities). The dry sample should then be packed into a melting point analysis capillary tube, which is simply a glass capillary tube with only one open end. Only 1 to 3 mm of sample is needed for sufficient analysis. The sample needs to be packed down into the closed end of the tube. This may be done by gently tapping the tube or dropping it upright onto a hard surface (Figure \(\PageIndex{2}\)). Some apparatuses have a vibrator to assist in packing the sample. Finally the tube should be placed into the machine. Some models can accommodate multiple samples.

Recording Data
Performing analysis is different from machine to machine, but the overall process is the same (Figure \(\PageIndex{3}\)). If possible, choose a starting temperature, ending temperature, and rate of change of temperature. If the identity of the sample is known, base the starting and ending temperatures from the known melting point of the chemical, providing margins on both sides of the range. If using a model without programming, simply turn on the machine and monitor the rate of temperature change manually.
Figure \(\PageIndex{3}\) A video discussing sample preparation, recording data and melting point analysis in general. Made by Indiana University-Purdue University Indianapolis chemistry department.
Visually inspect the sample as it heats. Once melting begins, note the temperature. When the sample is completely melted, note the temperature again. That is the melting point range for the sample. Pure samples typically have a 1 - 2 °C melting point range, however, this may be broadened due to colligative properties.
Interpreting Data
There are two primary uses of melting point analysis data. The first is for qualitative identification of the sample, and the second is for quantitative purity characterization of the sample.
For identification, compare the experimental melting point range of the unknown to literature values. There are several vast databases of these values. Obtain a pure sample of the suspected chemical and mix a small amount of the unknown with it and conduct melting point analysis again. If a sharp melting point range is observed at similar temperatures to the literature values, then the unknown has likely been identified correctly. Conversely, if the melting point range is depressed or broadened, which would be due to colligative properties, then the unknown was not successfully identified.
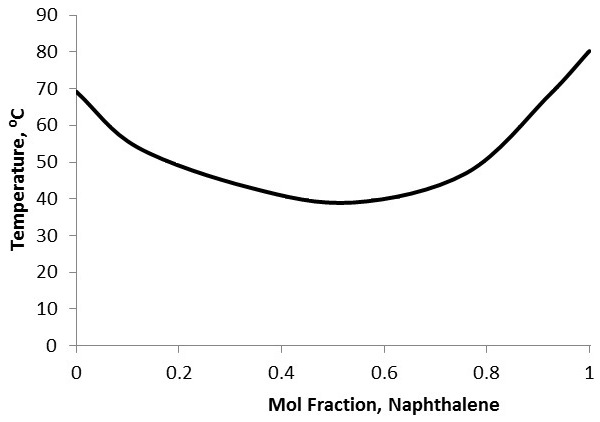
To characterize purity, first the identity of the solvent (the main constituent of the sample) and the identity of the primary solute need to be known. This may be done using other forms of analysis, such as gas chromatography-mass spectroscopy coupled with a database. Because melting point depression is unique between chemicals, a mixed melting curve comparing molar fractions of the two constituents with melting point needs to either be obtained or prepared (Figure \(\PageIndex{4}\)). Simply prepare standards with known molar fraction ratios, then perform melting point analysis on each standard and plot the results. Compare the melting point range of the experimental sample to the curve to identify the approximate molar fractions of the constituents. This sort of purity characterization cannot be performed if there are more than two primary components to the sample.
Specificity and Accuracy
Melting point analysis is fairly specific and accurate given its simplicity. Because melting point is a unique physical characteristic of a substance, melting point analysis does have high specificity. Although, many substances have similar melting points, so having an idea of possible chemicals in mind can greatly narrow down the choices. The thermometers used are also accurate. However, melting point is dependent on pressure as well, so experimental results can vary from literature values, especially at extreme locations, i.e., places of high altitude. The biggest source of error stems from the visual detection of melting by the experimenter. Controlling the change rate and running multiple trials can lessen the degree of error introduced at this step.
Advantages of Melting Point Analysis
Melting point analysis is a quick, relatively easy, and inexpensive preliminary analysis if the sample is already mostly pure and has a suspected identity. Additionally, analysis requires small samples only.
Limitations of Melting Point Analysis
As with any analysis, there are certain drawbacks to melting point analysis. If the sample is not solid, melting point analysis cannot be done. Also, analysis is destructive of the sample. For qualitative identification analysis, there are now more specific and accurate analyses that exist, although they are typically much more expensive. Also, samples with more than one solute cannot be analyzed quantitatively for purity.