1.16: An Accuracy Assessment of the Refinement of Crystallographic Positional Metal Disorder in Molecular Solid Solutions
- Page ID
- 55834

Introduction
Crystallographic positional disorder is evident when a position in the lattice is occupied by two or more atoms; the average of which constitutes the bulk composition of the crystal. If a particular atom occupies a certain position in one unit cell and another atom occupies the same position in other unit cells, the resulting electron density will be a weight average of the situation in all the unit cells throughout the crystal. Since the diffraction experiment involves the average of a very large number of unit cells (ca. 1018 in a crystal used for single crystal X-ray diffraction analysis), minor static displacements of atoms closely simulate the effects of vibrations on the scattering power of the “average” atom. Unfortunately, the determination of the “average” atom in a crystal may be complicated if positional disorder is encountered.
Crystal disorder involving groups such as CO, CN and Cl have been documented to create problems in assigning the correct structure through refinement procedures. While attempts have been made to correlate crystallographic lattice parameters with bulk chemical composition of the solution from which single crystal was grown, there has been little effort to correlate crystallographic site occupancy with chemical composition of the crystal from which single crystal diffraction data was obtained. These are two very different issues that must be considered when solving a crystal structure with site occupancy disorder.
What is the relationship of a single crystal to the bulk material?
Is the refinement of a site-occupancy-factor actually gives a realistic value for % occupancy when compared to the "actual" % composition for that particular single crystal?
The following represents a description of a series of methods for the refinement of a site occupancy disorder between two atoms (e.g., two metal atoms within a mixture of isostructural compounds).
Methods for X-ray Diffraction Determination of Positional Disorder in Molecular Solid Solutions
An atom in a structure is defined by several parameters: the type of atom, the positional coordinates (x, y, z), the occupancy factor (how many “atoms” are at that position) and atomic displacement parameters (often called temperature or thermal parameters). The latter can be thought of as being a “picture” of the volume occupied by the atom over all the unit cells, and can be isotropic (1 parameter defining a spherical volume) or anisotropic (6 parameters defining an ellipsoidal volume). For a “normal” atom, the occupancy factor is fixed as being equal to one, and the positions and displacement parameters are “refined” using least-squares methods to values in which the best agreement with the observed data is obtained. In crystals with site-disorder, one position is occupied by different atoms in different unit cells. This refinement requires a more complicated approach. Two broad methods may be used: either a new atom type that is the appropriate combination of the different atoms is defined, or the same positional parameters are used for different atoms in the model, each of which has occupancy values less than one, and for which the sum is constrained to total one. In both approaches, the relative occupancies of the two atoms are required. For the first approach, these occupancies have to be defined. For the second, the value can be refined. However, there is a relationship between the thermal parameter and the occupancy value so care must be taken when doing this. These issues can be addressed in several ways.
Method 1
The simplest assumption is that the crystal from which the X-ray structure is determined represents the bulk sample was crystallized. With this value, either a new atom type can be generated that is the appropriate combination of the measured atom type 1 (M) and atom type 2 (M’) percent composition or two different atoms can be input with the occupancy factor set to reflect the percent composition of the bulk material. In either case the thermal parameters can be allowed to refine as usual.
Method 2
The occupancy values for two atoms (M and M’) are refined (such that their sum was equal to 1), while the two atoms are constrained to have the same displacement parameters.
Method 3
The occupancy values (such that their sum was equal to 1) and the displacement parameters are refined independently for the two atoms.
Method 4
Once the best values for occupancy is obtained using either Methods 2 or 3, these values were fixed and the displacement parameters are allowed to refine freely.
A Model System
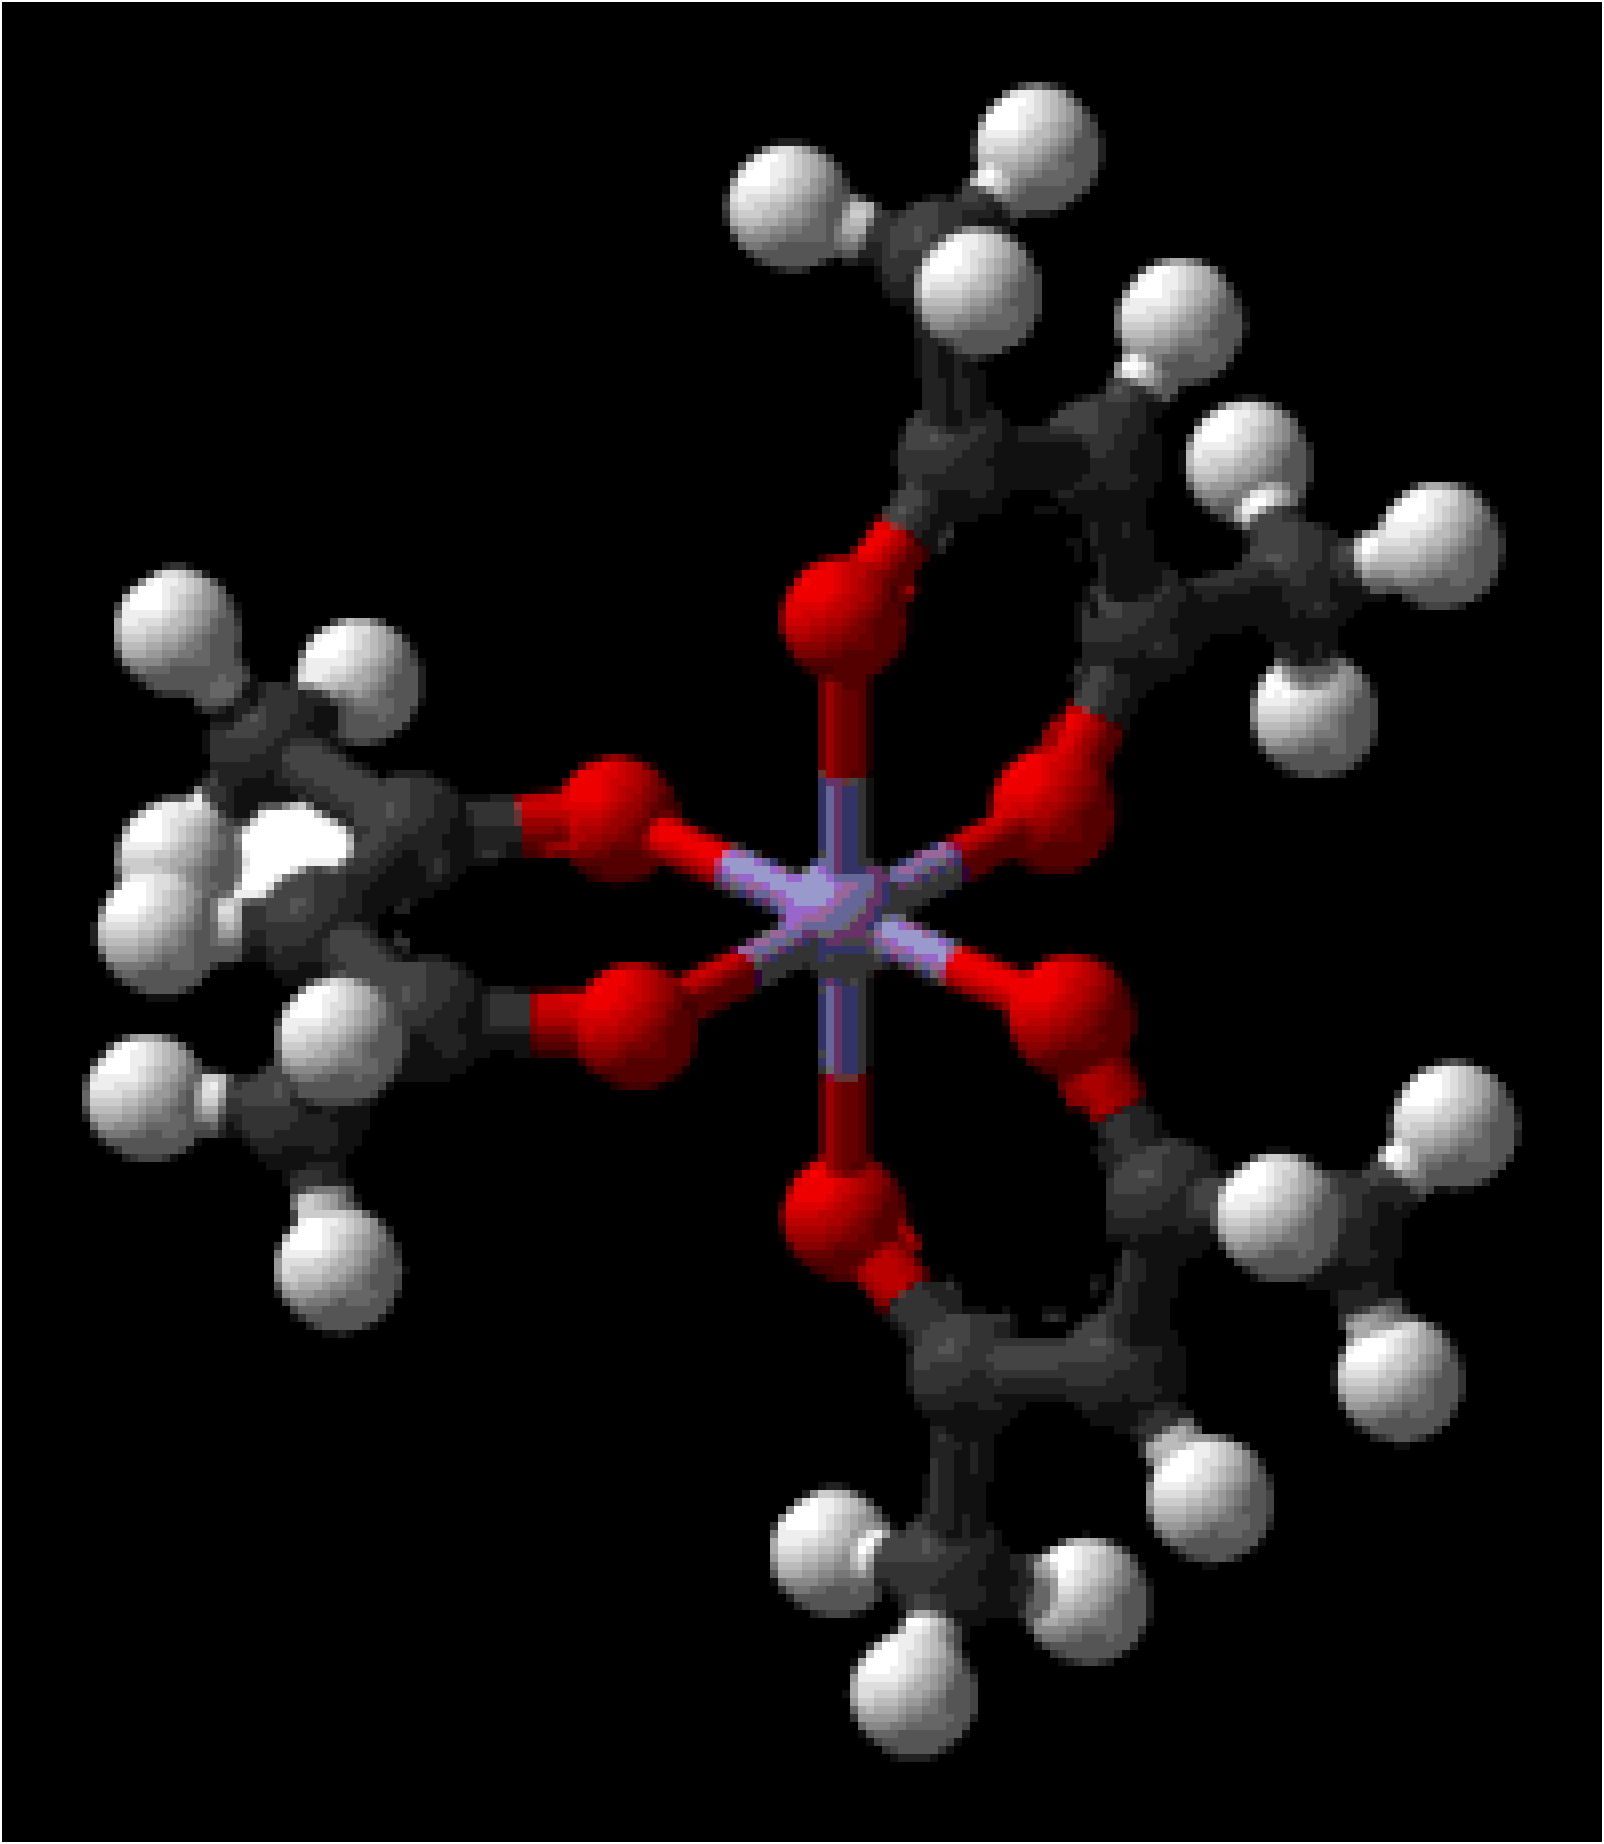
Metal β-diketonate complexes (Figure \(\PageIndex{1}\)) for metals in the same oxidation state are isostructural and often isomorphous. Thus, crystals obtained from co-crystallization of two or more metal β-diketonate complexes [e.g., Al(acac)3 and Cr(acac)3] may be thought of as a hybrid of the precursors; that is, the metal position in the crystal lattice may be defined as having the average metal composition.
A series of solid solutions of Al(acac)3 and Cr(acac)3 can be prepared for study by X-ray diffraction, by the crystallization from acetone solutions of specific mixtures of Al(acac)3 and Cr(acac)3 (Table \(\PageIndex{1}\), Column 1). The pure derivatives and the solid solution, Al1-xCrx(acac)3, crystallize in the monoclinic space group P21/c with Z = 4.
| Solution Composition (% Cr) | WDS Composition of Single Crystal (% Cr) | Composition as Refined from X-ray Diffraction (% Cr) |
| 13 | 1.9 ± 0.2 | 0a |
| 2 | 2.1 ± 0.3 | 0a |
| 20 | 17.8 ± 1.6 | 17.3 ± 1.8 |
| 26 | 26.7 ± 1.7 | 28.3 ± 1.9 |
| 18 | 48.5 ± 4.9 | 46.7 ± 2.1 |
| 60 | 75.1 ± 4.1 | 72.9 ± 2.4 |
| 80 | 91.3 ± 1.2 | 82.3 ± 3.1 |
Substitution of Cr for Al in the M(acac)3 structure could possibly occur in a random manner, i.e., a metal site has an equal probability of containing an aluminum or a chromium atom. Alternatively, if the chromium had preference for specific sites a super lattice structure of lower symmetry would be present. Such an ordering is not observed since all the samples show no additional reflections other than those that may be indexed to the monoclinic cell. Therefore, it may be concluded that the Al(acac)3 and Cr(acac)3 do indeed form solid solutions: Al1-xCrx(acac)3.
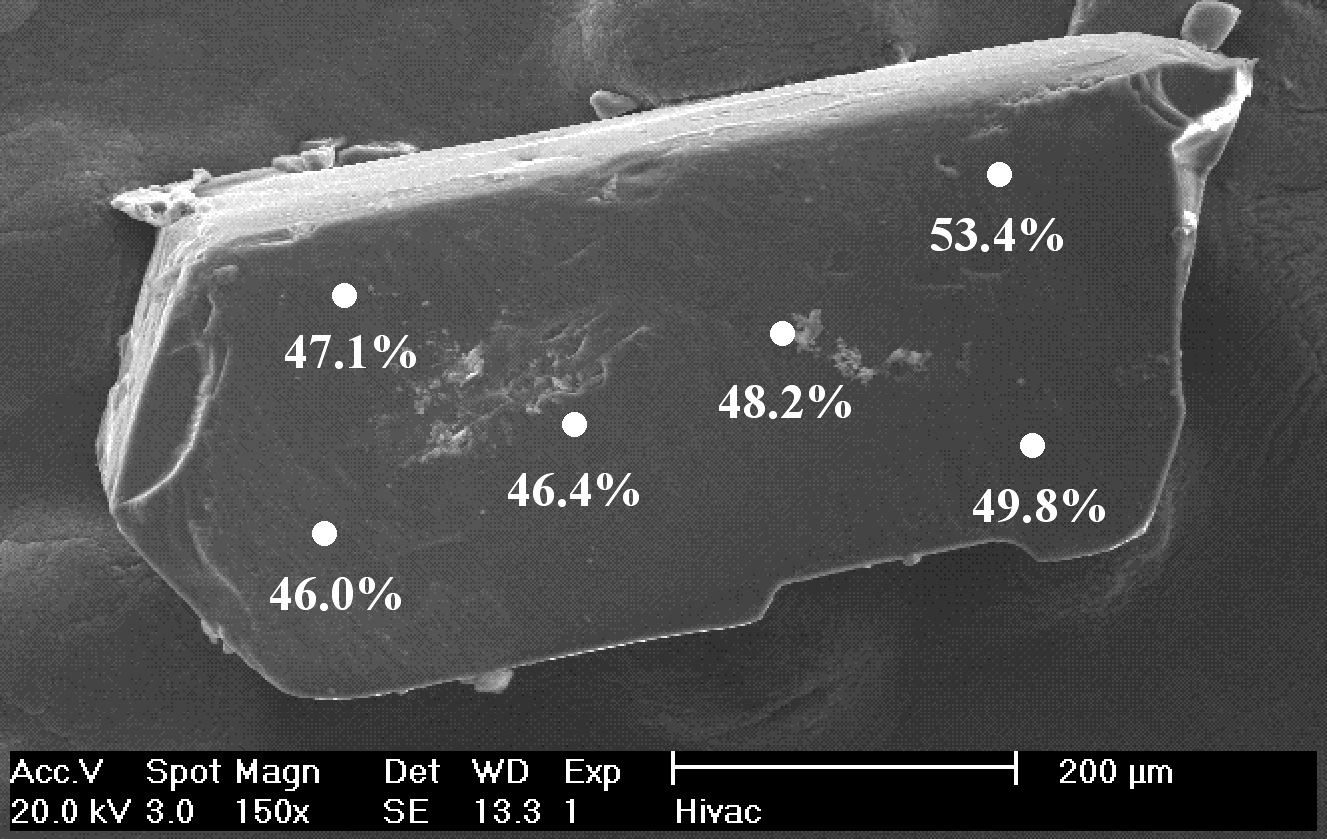
Electron microprobe analysis, using wavelength-dispersive spectrometry (WDS), on the individual crystal from which X-ray crystallographic data was collected provides the “actual” composition of each crystal. Analysis was performed on at least 6 sites on each crystal using a 10 μm sized analysis spot providing a measure of the homogeneity within the individual crystal for which X-ray crystallographic data was collected. An example of a SEM image of one of the crystals and the point analyses is given in Figure \(\PageIndex{2}\). The data in Table \(\PageIndex{1}\) and Figure \(\PageIndex{2}\) demonstrate that while a batch of crystals may contain individual crystals with different compositions, each individual crystal is actually reasonably homogenous. There is, for most samples, a significant variance between the molar Al:Cr ratio in the bulk material and an individual crystal chosen for X-ray diffraction. The variation in Al:Cr ratio within each individual crystal (±10%) is much less than that between crystals.
Comparison of the Methods
Method 1
Since Method 1 does not refine the %Cr and relies on an input for the Al and Cr percent composition of the "bulk" material, i.e., the %Cr in the total mass of the material (Table \(\PageIndex{1}\), Column 1), as opposed to the analysis of the single crystal on which X-ray diffraction was performed, (Table \(\PageIndex{1}\), Column 2), the closer these values were to the "actual" value determined by WDS for the crystal on which X-ray diffraction was performed (Table \(\PageIndex{1}\), Column 1 vs 2) then the closer the overall refinement of the structure to those of Methods 2 - 4.
While this assumption is obviously invalid for many of the samples, it is one often used when bulk data (for example, from NMR) is available. However, as there is no reason to assume that one crystal is completely representative of the bulk sample, it is unwise to rely only on such data.
Method 2
This method always produced final, refined, occupancy values that were close to those obtained from WDS (Table \(\PageIndex{1}\)). This approach assumes that the motion of the central metal atoms is identical. While this is obviously not strictly true as they are of different size, the results obtained herein imply that this is a reasonable approximation where simple connectivity data is required. For samples where the amount of one of the elements (i.e., Cr) is very low so low a good refinement can not often be obtained. In theses cases, when refining the occupancy values, that for Al would exceed 1 while that of Cr would be less than 1!
Method 3
In some cases, despite the interrelationship between the occupancy and the displacement parameters, convergence was obtained successfully. In these cases the refined occupancies were both slightly closer to those observed from WDS than the occupancy values obtained using Method 2. However, for some samples with higher Cr content the refinement was unstable and would not converge. Whether this observation was due to the increased percentage of Cr or simply lower data quality is not certain.
While this method does allow refinement of any differences in atomic motion between the two metals, it requires extremely high quality data for this difference to be determined reliably.
Method 4
This approach adds little to the final results.
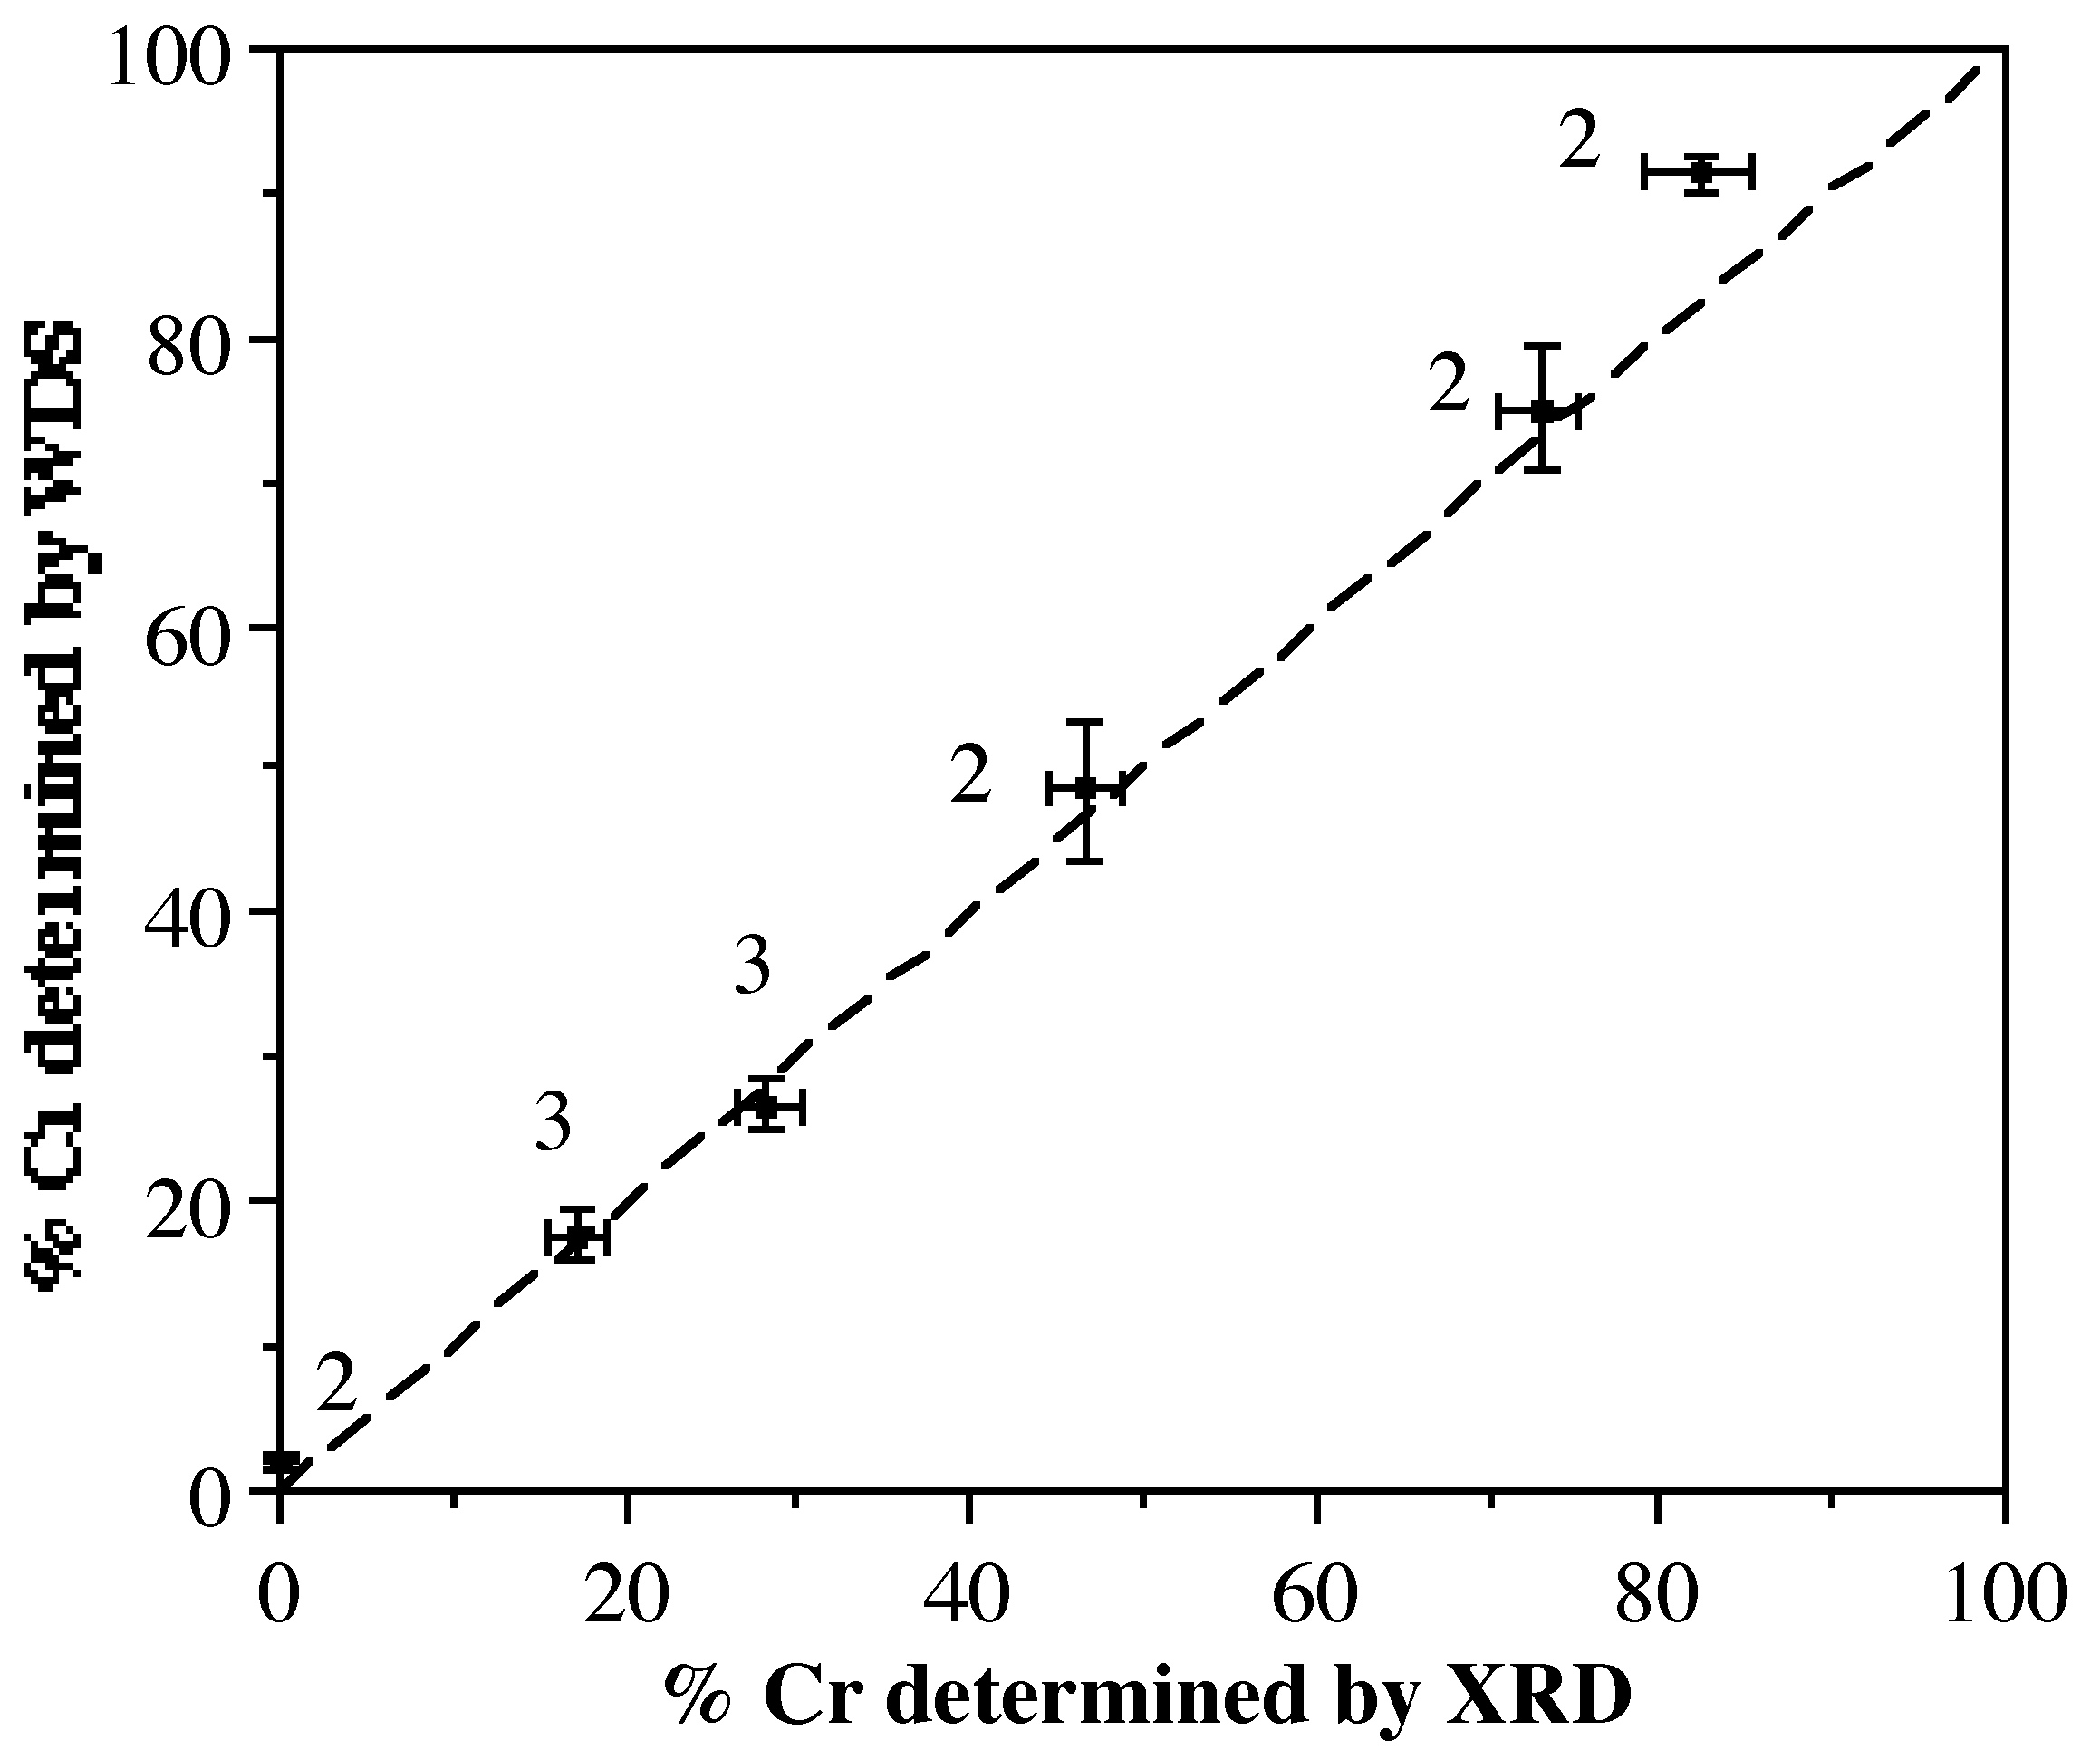
Correlation between Analyzed Composition and Refined Composition
Figure \(\PageIndex{3}\) shows the relationship between the chromium concentration (%Cr) determined from WDS and the refinement of X-ray diffraction data using Methods 2 or 3 (labeled in Figure \(\PageIndex{3}\). Clearly there exists a good correlation, with only a slight divergence at high Cr concentration. This is undoubtedly a consequence of trying to refine a low fraction of a light atom (Al) in the presence of a large fraction of a heavier atom (Cr). X-ray diffraction is, therefore, an accurate method of determining the M:M' ratios in crystalline solid solution.