10.5: IR Spectra
- Page ID
- 213355

TRANSMISSION vs. ABSORPTION
When a chemical sample is exposed to the action of IR LIGHT, it can absorb some frequencies and transmit the rest. Some of the light can also be reflected back to the source.
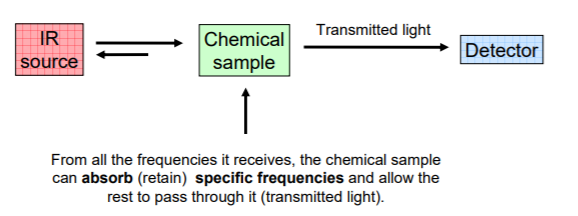
The detector detects the transmitted frequencies, and by doing so also reveals the values of the absorbed frequencies.
AN IR SPECTRUM IN ABSORPTION MODE
The IR spectrum is basically a plot of transmitted (or absorbed) frequencies vs. intensity of the transmission (or absorption). Frequencies appear in the x-axis in units of inverse centimeters (wavenumbers), and intensities are plotted on the y-axis in percentage units.
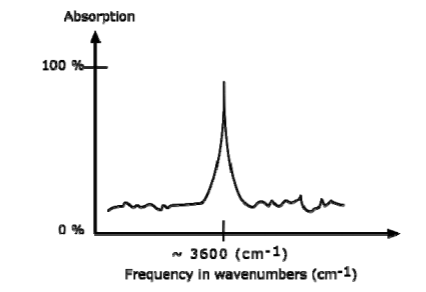
The graph above shows a spectrum in absorption mode.
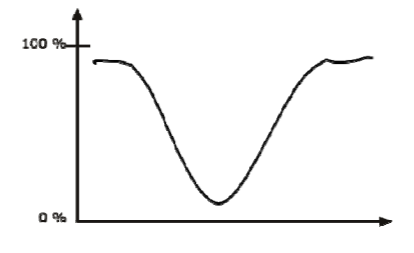
AN IR SPECTRUM IN TRANSMISSION MODE
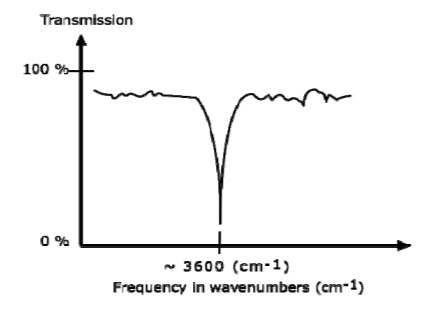
The graph above shows a spectrum in transmission mode. This is the most commonly used representation and the one found in most chemistry and spectroscopy books. Therefore we will use this representation.
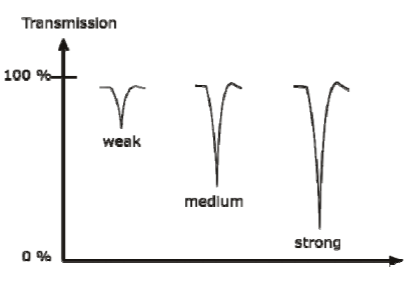
CLASSIFICATION OF IR BANDS
IR bands can be classified as strong (s), medium (m), or weak (w), depending on their relative intensities in the infrared spectrum. A strong band covers most of the y-axis. A medium band falls to about half of the y-axis, and a weak band falls to about one third or less of the y-axis.
INFRARED ACTIVE BONDS
Not all covalent bonds display bands in the IR spectrum. Only polar bonds do so. These are referred to as IR active.
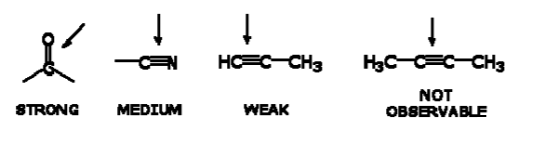
The intensity of the bands depends on the magnitude of the dipole moment associated with the bond in question:
- Strongly polar bonds such as carbonyl groups (C=O) produce strong bands.
• Medium polarity bonds and asymmetric bonds produce medium bands.
• Weakly polar bond and symmetric bonds produce weak or non observable bands.
INFRARED BAND SHAPES
Infrared band shapes come in various forms. Two of the most common are narrow and broad. Narrow bands are thin and pointed, like a dagger. Broad bands are wide and smoother.
A typical example of a broad band is that displayed by O-H bonds, such as those found in alcohols and carboxylic acids, as shown below.