8.4: Analyzing the Fractions by TLC
- Page ID
- 213345

The sample under analysis may or may not be colored. If it is colored, you can see the bands separate as they travel down the column. This enables you to more precisely collect the different fractions. However, it is always possible that each fraction may have more than one component if they all travel together due to similarities in their polarities and structures. It is good and common practice to further analyze each fraction by TLC. This process frequently reveals more than one component in fractions which may otherwise be taken as consisting of a single, pure substance.
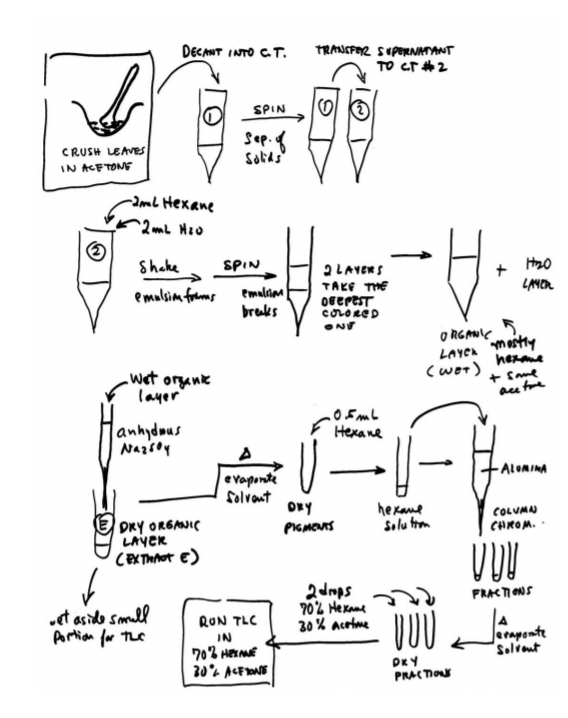
In experiment 16 you will obtain at least two fractions from the chromatographic column, one yellow and one green. However, TLC analysis of each will further reveal the presence of several pigments in each fraction. Your job is to find out how many are there and what their Rf values are. Your textbook lists the various pigments you are likely to see (p. 142), but this may vary from one type of spinach to another, and even with how fresh the leaf was at the time of the experiment.
If the sample under analysis is colorless, you cannot visually guide the fraction collecting process. In this case it is customary to collect fractions of equal size in different test tubes during the entire elution time. Each fraction is then analyzed by TLC. This will reveal first whether the fractions contain anything at all, and second whether they consist of a pure component or a mixture. All fractions containing the exact same components (according to their Rf values and general appearance) are then combined. This process takes more time and more patience, but it has become largely automated in modern scientific and industrial laboratories where time savings translate into lower operational costs.