
2.1: Day 1 Procedure - Kinetics of the Enzyme Catalase
- Page ID
- 211999
Day #1: A Study of the Kinetics of the Enzyme Catalase in the Decomposition of Hydrogen Peroxide
In Day #1 of the experiment the catalytic decomposition of hydrogen peroxide by the enzyme catalase is investigated:
\[ \rm 2 H_2O_{2 \space\space\space (aq)} \xrightarrow{catalase} O_{2 \space\space\space (g)} + 2 H_2O_{(l)}\]
The catalase hydrogen peroxide reaction will be studied and the order of the reaction will be determined with respect to hydrogen peroxide. We will use the order of the reaction determined in Day 1 to calculate the rate constant k on Day 2 when we conduct a temperature study to determine the energy of activation for the reaction from an Arrhenius plot. The reaction will be followed by monitoring the pressure in a reaction tube using a low-cost computer interfaced gas pressure sensor by which we can monitor the pressure increase inside the closed off reaction tube. The initial rate of the reaction is simply the maximum slope of the curve resulting from the plot of pressure of oxygen generated versus time immediately after the reaction begins. The rate during the first minute or so should appear to increase at a relatively constant rate giving the graph a linear appearance. We will determine the rate by finding the maximum slope of this line, which should represent a good approximation of the initial rate.
The order of the reaction will be determined by running a series of experiments varying the concentration of hydrogen peroxide and finding the initial rates for each of five reactions. We will do a graphical plot of the data from a series of five reactions to determine the order of the reaction (a) as represented in the rate equation below:
\[ \rm rate = k[H_2O_2]_0^a\]
\[ \rm ln(rate) = a \space ln([H_2O_2]_0) + ln \space k\]
A plot of the natural log of the rate versus the natural log of the initial hydrogen peroxide concentration from each of the five trials should give us a straight line with the slop = a the order of the reaction with respect to hydrogen peroxide.
The units for rate will initially be in (M/s) [oxygen] generated per second. Using the stoichiometry of the equation and the Volume of gas (Vg) and Volume of solution (Vs) we can readily convert this into M/s in terms of hydrogen peroxide decomposing.
In order to determine the value for the rate constant (k) the units for the rate and the units for the concentration of hydrogen peroxide have to have some consistency. Once the units of the rate and concentration are consistent a value for k can be calculated as follows:
\[ \rm k = \dfrac{rate}{[H_2O_2]^a_0}\]
In general, for a first order reaction we can write an expression for the differential rate law as follows:
\[ \rm A \rightarrow Products\]
\[ \rm Rate = - \dfrac{\Delta [A]_t}{\Delta t} = k[A]_0\]
Using calculus, we can derive the integrated rate law:
\[ \rm ln\dfrac{[A]_t}{[A]_0} = -kt\]
Note the units for k for a first order reaction:
\[ \rm k = \dfrac{rate}{[A]_0} = \dfrac{\dfrac{M}{s}}{M} = \dfrac{1}{s}\]
Similarly, for a second order reaction we can write an expression for the differential rate law:
\[ \rm A \rightarrow Products\]
\[ \rm Rate = \dfrac{\Delta [A]_t}{\Delta t} = k[A]_0^2\]
Using calculus, we can derive an integrated rate law:
\[ \dfrac{1}{[A]_t} = kt + \dfrac{1}{[A]_0}\]
Note the units for k for a second order reaction:
\[ \rm k = \dfrac{rate}{[A]_0^2} = \dfrac{\dfrac{M}{s}}{M^2} = \dfrac{liter}{mole - sec}\]
In both of the above cases its important to note that the units for rate are M/s to make sense in calculating the rate constant.
Experiment Outline
Preparation of Stock Slutions9:
- TAs prepare Stock Phosphate Buffer Solution—Dissolve 27.2 grams of NaH2PO4 x H2O in 2 Liter of distilled water. Adjust the pH to 6.8 by slowly adding concentrated NaOH with stirring. This should yield a 2 Liter pH=6.8 Phosphate Buffer Solution approximately 0.1 M. TAs should plan on about 0.75 Liter of Stock Buffer Solution for each student team for the Day 1 & 2 Experiments
- TAs prepare Stock Catalase Enzyme Solution—Dissolve approximately 35 mg of purified catalase from bovine liver culture into 200 mL of the above phosphate buffer stock solution. This solution must be prepared fresh at the start of each experiment, as catalase is known to decompose via aerobic oxidation. TAs should calculate on having about 15 mL per student team on Day 1 and 15 mL per student team on Day 2. Enzyme should be prepared in the air-conditioned catalase room and kept there for the duration of the lab.
- Student prepares working solution of H2O2—Pour out 13.3 mL of 30% hydrogen peroxide solution and dilute to 100 mL in a volumetric flask with the above phosphate buffer solution. This solution must be prepared immediately on the day of the experiment. This should yield 100 mL of a 4% H2O2 stock solution.
- Student prepares working solution of Phosphate Buffer—33 mL of distilled water is mixed with 217 mL of the above stock phosphate buffer solution, yielding 250 mL of a working buffer solution containing the same concentration of phosphate as the stock H2O2 solution.
Equipment10:
Each Team will set up an apparatus similar to that shown in Figure 5 below. The apparatus consists of a glass closed pressure tube connected to an electronic pressure sensor that is interfaced to the student / lab computer. The gas pressure tube where the reaction takes place can be submerged in a large beaker of room temperature water to keep the reaction mixture at a constant temperature. The volume of the reacting mixture occupies about a third of the entire volume of the tube so that the reaction can be stirred vigorously with a small stir bar to help promote the rapid evolution of O2 (g). In this experiment, we will use a Vernier gas pressure sensor (#GPS-BTA) connected to a Go- Link computer interface, the interface is connected directly to a computer, which will be fitted with Logger Pro data acquisition software.
Method:
Each team as assigned by the TA will set up the apparatus shown in Figure 5.
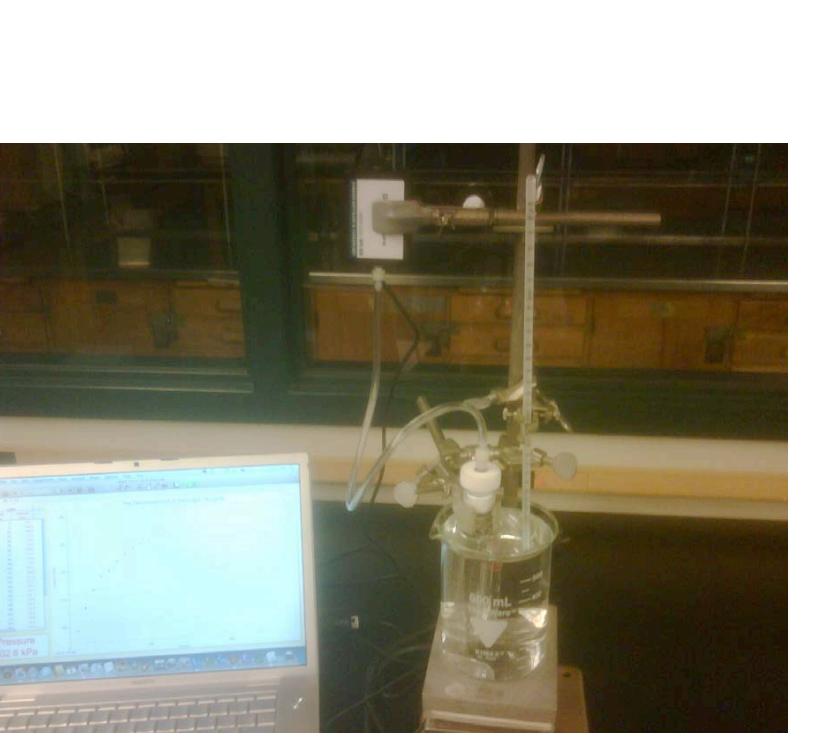
Figure 5. Apparatus for Measuring Kinetics of Catalase-H2O2 Decomposition11
The reaction vessel consists of a glass pressure tube that can be sealed quickly by spinning on a Teflon threaded plug that is fitted with a rubber O-ring. The Teflon plug has another threaded outlet that is custom fitted with two O-rings and connects directly to the computer interfaced gas pressure probe. About 80-90% of the pressure tube can be submerged in a 600-mL beaker of water during the collection of data to facilitate a constant temperature during each of the kinetic runs. Obtain room temperature water and set up the bath in a 600-mL beaker. Use a thermometer to measure the temperature of the water bath. Record this temperature into your laboratory notebooks. You should monitor the temperature of the water bath constantly throughout the entire experiment. A stir bar and magnetic stir plate is used to vigorously stir the reaction contents inside the pressure tube to promote the rapid evolution of O2 (g). The stir bar rate of stirring should be set before adding the enzyme and should not be changed during the collection of data. The Gas Pressure sensor is connected to a Vernier computer interface Go-Link connector that plugs directly into any computer. Connect the gas pressure sensor to the top of the Teflon® threaded interface. Start the Logger Pro data-monitoring program on computer and open the appropriate collection file called Module 12 Peroxide.
Each team will run five trial runs, which vary the concentration of the hydrogen peroxide keeping the concentration of the enzyme constant. The following data Table 1 illustrates suggested volumes of stock reagents, which can be used in each trial. The individual teams could vary these concentrations slightly then calculate the corresponding concentration for the hydrogen peroxide solutions used based on the stock reagents tabulated.
| Solution I | Solution I | Solution II | |||
| Stock H2O2 mL | Phosphate Buffer mL | Stock Enzyme mL | Total Volume mL | [H2O2] mol/L | Reaction Rate Ms-1 |
| 0.25 | 23.75 | 1.00 | 25.00 | ||
| 0.50 | 23.50 | 1.00 | 25.00 | ||
| 1.00 | 23.00 | 1.00 | 25.00 | ||
| 1.50 | 22.50 | 1.00 | 25.00 | ||
| 2.00 | 22.00 | 1.00 | 25.00 |
Table 1 Suggested Volumes of Stock reagents for the Kinetics Decomposition of H2O2.
To begin, remove the pressure tube from the water bath and unscrew the threaded Teflon® plug and seal, now, insert the stir bar into the pressure tube along with the first volume of Solution I which includes the stock H2O2 and the Phosphate buffer (this can be done in an empty beaker set up near the apparatus). Now carefully screw the Teflon plug onto the pressure tube and place it into the apparatus 600 mL beaker water bath clamping it near the top edge of the white Teflon threaded plug so that the pressure tube is as far down into the 600 mL beaker as you can get close to the magnet for effective contact with the stir bar. Start your stir bar for a constant stir rate. The rate of stirring must not change during the entire experiment otherwise, you will experience drops in pressure that will cause dips in your graph. You should try to use the same stir bar rate for each trial keeping the dial set at that particular rate. Practice setting the stir rate, making sure it remains fixed for the duration of each run. The next part must be done quickly. Using a digital pipette, inject 1.00 mL of stock solution of catalase Solution II directly through the hole in the luer lock on the Teflon plug using an automatic 1000 µL pipettor, the hole is then quickly closed by connecting the luer lock fitting to the Vernier gas probe with a gentle turn. When you attach the luer lock from the pressure sensor to the luer lock in the Teflon plug be careful not to twist tighten otherwise you will end up stripping the connection and the tube will have a leak. Make sure that you set the stir rate for maximum stirring before you inject the enzyme and leave it constant throughout the entire reaction. When you inject the enzyme, the pipette must be held firmly straight with the tip placed into the open luer lock, then, a quick injection of the enzyme. If the pipette is not firmly in place or crooked the enzyme will shoot out all over the outside of the reaction vessel and you will need to repeat. Practice with water several times to make sure you are comfortable injecting the enzyme into the reaction tube. As soon as the enzyme has been added to the pressure tube and you have snapped on the gas probe connector click collect to begin data collection. The entire process of injecting the enzyme, closing the luer lock and pressing start on the computer should take place in 1-2 seconds. I believe the software is designed to run for 5 minutes, however, you can and should during the run click on Experiment at the top of the screen and click extend run to 450 seconds as this will give you the best data for your file. If your pressure curve is not rising during the run you may have a leak and you should call this to the attention of your TA and figure out where the leak may be coming from. After collecting the data when the time has elapsed, carefully release the luer lock connection and unscrew the Teflon® cap to relieve the pressure in the tube. Remove the tube from the water bath and dispose of the contents into the appropriate waste collection flask for this module, which the TAs will set up on the lab bench. Save the data set to a disc drive or appropriate file on the computer. Rinse and clean the pressure tube with distilled water and prepare for the second thru the fifth trials as above. At the end of running the five trials you can begin to analyze the graphs with the data analysis options included with the software. Carefully examine the graph, and select a point just beyond the initial flat upward inflection portion and use the data analysis software to determine the slope of the tangent line (m) corresponding to the steepest point in your pressure v. time curve. You can click the Linear Regression button on the software program to calculate the best-fit line equation that fits the graph at the steepest slope. The slope of the tangent line is your initial rate of your reaction and should be recorded into your laboratory notebooks.
Analysis and Discussion
- Using the volumes of stock solutions, in Table 1, calculate the molar concentrations for the H2O2 in each trial.
- Calculate the air space volume above your reacting solution in the pressure-tube you used (at the temperature of your water bath) to do this mass the empty tube and Teflon cap, fill the tube with water and close the Teflon® threaded cap, then mass the tube again filled with water, take the temperature of the water and use the density of water to calculate the total volume of water that filled the tube, subtract the 25.00 mL you used for your reactions and you should now have the volume of the airspace above your reacting solution. Be sure to include the volume of air space in the tube that is connected to the pressure sensor (3.62 mL). The total air space volume calculated represents the volume of O2 (g) collected Vg.
- Calculate the initial rate of oxygen formation for each trial, which is simply the maximum slope of the curve (m) in your plot of Pressure v. Time. This slope, will have units of kPa/sec, and is the initial rate for the reaction.
- Calculate the initial rate of reaction for each trial in units of M/s by dividing the observed slope of the tangent line (m) from (3) above by RT. (R=8.314 LkPa/mole-K). You should end up with the rate of formation of Oxygen d[O2]/dt in (M/s).
- Using the Vg, Vs, and the stoichiometry of the reaction convert the above rate in (4) into the rate hydrogen peroxide used up (- d[H2O2]/dt) (M/s).
- Construct a table of your results include the mass of water in your pressure tube (g), the temperature of the water (°C), density of water from Chemistry and Physics Handbook (g/mL), Volume of the Pressure tube (mL), Volume of solution Vs, (mL), Volume of Gas, Vg (mL), Room Pressure, 4% H2O2 volumes (mL), [H2O2] (M), Temperature for each trial (°C) & (K), Rate (kPa/s), Rate O2 M/s, Rate O2 mole/s, Rate H2O2 mole/s, Rate M/s with respect to H2O2.
- Do a plot of ln(Rate) v. ln[H2O2]0 and determine the order for the reaction.
\[ \rm rate_o = k[H_2O_2]_o^a\]
\[ \rm ln(rate_o) = ln(k * [H_2O_2]_o^a)\]
\[ \rm ln(rate_o) = a * ln([H_2O_2]_o) + ln(k)\]
\[ \rm y = m * x + b\]
Footnotes
9 Solutions modified from supplement available at https://pubs.acs.org/doi/abs/10.1021/ed086p1227, cited in Lewis, M. E.; Levine, R. M.; York, J. T.; Grubbs, W. T., Journal of Chemical Education, (2009) 86, 1227-1230.
10 Equipment adapted and modified from supplement available at https://pubs.acs.org/doi/abs/10.1021/ed086p1227, cited in Lewis, M. E.; Levine, R. M.; York, J. T.; Grubbs, W. T., Journal of Chemical Education, (2009) 86, 1227-1230.
11 Adapted and modified from: Lewis, M. E.; Levine, R. M.; York, J. T.; Grubbs, W. T., Journal of Chemical Education, (2009) 86, 1227-1230.