
Part A
- Page ID
- 60673

I. Why build a spectrophotometer as opposed to anything else
Given that there are thousands of different analytical instruments, why build a spectrophotometer? Aside from those who are blind, eyesight is one of the richest paths humans have for learning about the world. Color is one of the earliest stimuli we can identify, even before faces (my youngest daughter turned her head to track the bright blue screen of a PC when she was one day old). We thus develop intuition most quickly when we can see how data are formed rather than simply trusting equations or our other senses.
Visual spectrometric instruments date from at least the time of Newton. Since the middle of the 19th century, with the development of photographic plates, and then in the 20th century with the development of photomultipliers and photodiodes, it was ludicrous to think that reasonable measurements could be made with nearly-free equipment. When digital cameras first appeared, they were not only expensive, but also had such limited dynamic range that most spectroscopists dismissed their utility out of hand. Since 2007, however, two things have changed. The first is that over 1/6 of humanity has access to a cellular telephone, and a large fraction of those phones have built-in cameras. Thus, what was previously the most expensive, least easily obtained component of a spectrometer, is now in wide circulation. The second change has been the realization that, if an instrument works too well, it is hard to grasp the ideas about the instruments foibles. Having an instrument whose flaws are clearly displayed is an asset in teaching. So let's go build a (really bad!) spectrophotometer.
II. Why home-built instruments are becoming practical
The same insights that led to this experiment are being exploited to develop inexpensive medical and water quality test devices. The best known person in the US working on these ideas is George Whitesides at Harvard University, who is using microcontact printing to make 96 well test plates that use a cell phone and the internet to send data to a central lab for analysis. Pre-printed color panels, analogous to color reference panels used on spacecraft for camera calibration, are used to standardize the data. Everyone recognizes that, as cell phones get smarter, the data will not be sent to a central facility. Rather, the results of the tests, processed with software on the cell phone, will report a diagnosis, send the diagnosis to an appropriate node on the net, and then alert the phone's owner of the doctor's medical advice. In the distant future (at least a few years!), there may be a sufficiently reliable database in many phones that the MD will only be consulted in unusual, confusing situations.
III. Components of a spectrophotometer
List the components of a spectrophotometer in the order they are typically laid out for single wavelength measurement:
__________→___________→____________→____________ (after which the signal is transduced to a number)
Now list the components in the order they are typically laid out for full spectral observation in parallel:
__________→___________→____________→____________ (after which the signals from the multiple elements in the final component are transduced to a number)
There are many variations on each component.
The light source with which you will work is an RL-5-W5020 white LED, the specifications for which you can find at http://www.superbrightleds.com/specs/w2_specs.htm. Here's the spectral output:
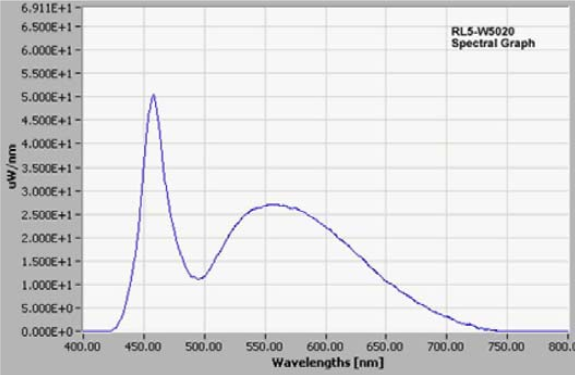
The output power is specified for a current of 20 mA which requires a drive voltage of 3.8 V. Our 3V batteries barely provide 2 mA, so output is only about 1/10 of the full power rating (based on reading the specifications. Would you trust the specifications? How would you measure if the estimate of current from the battery is correct?)
You will be supplied with a plastic 1 cm pathlength cuvette to hold a liquid sample. These are regarded as "disposable" because they are inexpensive. However, there is no reason not to use them many times provided samples don't stick to the polystyrene surface, leading to cross-contamination, solvents don't cause the plastic to deteriorate, and the outside stays free of scratches.
The diffraction grating is a holographic transmission grating, 12700 lines/inch or 500 lines/mm. These gratings are not blazed.
What is the detector? Only you know that. Any device that can generate a JPG picture can act as the array detector for this spectrophotometer! Do you have a digital camera? A cell phone with a camera? A webcam? If you don't have one, find a friend who does.
My detector is: ____________________________
IV. Layout of home-built instrument
Clearly, for there to be any hope of having this work, the components have to be aligned reproducibly. While a paper "baseplate" is provided, you should use ingenuity to devise something better. Kathleen Kelley found a piece of Styrofoam and linked everything to that base, which is much sturdier than folded paper. What will you use?
The LED leads are the right spacing so that the battery slides between them and the LED immediately turns on. Which leg goes on top? The LED must be forward biased (anode on the + side of the battery). In theory, the battery should be able to illuminate the LED for a total of 80 hours before burning out. This has not been tested. If you aren't using the LED, slip it off the battery to conserve power. The baseplate folds in such a way that the LED is at the right height to be centered along the grating. Should the LED shine along the center axis of the grating? Should the grating be offset at some angle?
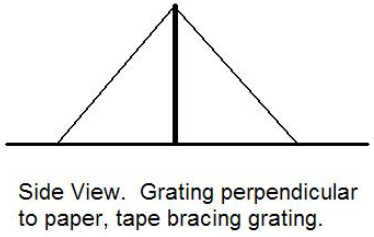
Should the LED shine directly in line with the grating or be aimed to one side? The specification is that the LED emits most of its light ±10º from the diode's axis. Play with this – see what alignment makes sense. How can the grating be kept upright? Tape it in place with a hinge at the bottom and two pieces of tape making right triangles.
Where will the detector go? Where will the cuvette go? Are there ambiguities? Do you see multiple diffraction orders? Which order will you use? Why? Once you see what angle you want to use, how far from the grating will you want to be with the camera lens (approximately)? How did you reach this estimate? What will happen if the distance varies by 10%?
V. If it works right, how would we obtain and process data?
Suppose we get everything put together just right. What relationship between measurement and concentration will be used with this instrument? Beer's Law, A(λ)=ε(λ)bC. Can we measure A directly? No. What can we measure? Transmittance, T? No. All we can measure is light intensity.
\[\varepsilon (\lambda)bC= \log_{10}\left(\dfrac{I_0(\lambda)}{I(\lambda)}\right)\]
How do you know ε(λ)? You don't – for each compound and solvent, it must be measured. How do you know b, and what is its value?
At minimum, how many intensity measurements must be made to determine ε(λ)?
"How will we get from a picture to an intensity? Your fearless instructor is writing software, to be described in §XIII below. Software can manipulate JPG files, but YOU will have to provide valid files with meaningful intensity measurements for the software to work.
VI. What isn’t ideal about the current layout?
Compared to a commercial spectrophotometer, what do you see (even before you collect any data) as non-ideal about this instrument? Discuss what would work well for a real instrument, what you have here, and how the two compare. Incidentally, there are at least a few things about this instrument that are superior to any commercial spectrophotometer, so look for positive points as well as negative!